Comparable Company Analysis: Guide, Example & Interview Questions
Most of the business valuation methods investment bankers use fall into two main categories: relative and intrinsic valuation. Intrinsic valuation estimates a company’s worth based on its fundamentals and future cash flows while relativevaluation, also called market-based valuation, determines a firm’s value by comparing it to the market pricing of similar businesses.
The most common intrinsic method is the Discounted Cash Flow (DCF) analysis. On the relative side, bankers rely on Precedent Transactions and Comparable Company Analysis (CCA). These three valuation methods are heavily tested in investment banking interviews because bankers use them constantly in real work including M&A advisory.
But this guide will focus on CCA and includes Comparable Company Analysis steps, key valuation multiples, advantages and limitations, a worked example, and common interview questions.
Comparable Company Analysis is a market-based valuation method that determines what a company is worth by looking at how similar, publicly traded companies are currently being valued by the market. The logic behind it is that if two companies are in the same industry, have similar business models, and operate at a comparable scale, the market should value them similarly.
But the pricing is expressed in valuation multiples, that is ratios like EV/EBITDA, not dollar amounts. This makes it possible to perform an "apples-to-apples" comparison of companies with different sizes, debt levels, and revenue scales.
For example, if similar companies are trading at 10 times their annual earnings, you can apply that same multiple to your target company's earnings to estimate its value, and determine whether it’s overvalued vs undervalued compared to its peers. Other popular names for CCA include comps analysis, trading comps, or public market comparables.
Why Comparable Company Analysis Matters
One of the biggest reasons why comps valuation is used heavily is that it's anchored in real market data. The multiples are derived from actual stock prices and hence shows what thousands of informed investors are collectively willing to pay for these businesses right now. That makes the numbers defensible as it’s easy to point a stakeholder who disagrees with the valuation to the market rather than defending a set of internal assumptions.
In a typical M&A process, CCA serves three practical purposes:
Establishing a Valuation Baseline: Before putting a company on the market, sell-side bankers use CCA to establish an initial, market-backed price range. This manages the seller’s expectations and helps set a realistic starting point or asking price for negotiations with potential buyers.
Assessing Price Fairness: On the buy-side, acquisition teams use CCA to evaluate whether an asking price makes sense. Buyers can instantly spot if a company is fairly priced, a bargain, or overvalued by comparing the target’s metrics to active public peers.
Forming the Foundation of a Football Field Valuation Chart: Investment bankers visually stack different valuation methods, like DCF, Precedent Transactions, and CCA on a single bar chart called a football field. Comps analysis provides the current market-trading benchmark, helping stakeholders see where all the valuation ranges overlap to find the target's ultimate value.
How Does Comparable Company Analysis Work?
Here’s how to do a comps analysis step by step.
Step 1: Select the Comparable Companies (Peer Group)
The entire comps analysis depends on choosing the right companies. Otherwise the valuation will be misleading no matter how clean the rest of your work is. Here’s how to select comparable companies using two main categories:
Financial Profile: Look for similarities in revenue size and model, growth rate, profit margins, and capital structure (debt vs. equity).
Operational Profile: Look for companies in the same industry or sector, with similar products or services, targeting the same customer demographics, and operating in the same geographic regions or comparable markets.
An analyst will start by looking at the target's direct competitors, reviewing industry reports, or checking equity research reports to see who Wall Street considers peers. Ideally, you want a tight list of 5 to 10 highly relevant companies.
Step 2: Gather the Financial Data
Once the peer group is set, collect the financial data for each company. The data should cover the last twelve months (LTM) and the next twelve months (NTM). For public companies, the historical data covering the past 12 months can be sourced from SEC filings (10-K and 10-Q reports for U.S. companies), earnings releases, and investor presentations.
But the next 12 months projections or forward-looking data typically comes from financial data terminals like Bloomberg, Capital IQ, or FactSet. The key financial metrics to gather include:
EBITDA (Earnings Before Interest, Taxes, Depreciation, and Amortization)
It’s also important to perform calendarization. This means making sure all the companies' financials are aligned to the same time period. If some have fiscal years ending in December and others end in March or June, comparing raw LTM figures is misleading.
Step 3: Spread the Comps or Calculate Ratios & Multiples
Spreading the comps means inputting the financial data into a standardized spreadsheet to calculate valuation multiples for each company. If calculating manually, take the Enterprise Value of each company and divide it by the relevant financial metric, such as revenue to get your multiple. We’ll cover the valuation multiples in more details later.
Step 4: Benchmark the Companies
Once you've calculated all the multiples for your peer group, compile them into a summary table and calculate the mean, median, 25th percentile, and 75th percentile. You’ll need to take a position on where your target company should fall within that range. Does it deserve to trade at the median? At a premium to the peer group because it has higher margins or faster growth? At a discount because it's smaller, underperforming, or less liquid?
Step 5: Apply the Multiples to Value the Target Company
Finally, take the relevant metric of your target company, for example its Last Twelve Months EBITDA, and multiply it by the benchmark multiple of the peer group.
For example, if your target’s EBITDA is $50 million, and the median peer group EV/EBITDA multiple is 10x, your target’s estimated Enterprise Value is:
EV = $50 million x 10 = $500M
Most Important Valuation Multiples
As mentioned earlier, valuation multiples are ratios that express a company's value relative to a financial metric like revenue or earnings. Each valuation multiple falls under either Enterprise Value (EV) Multiples which value the whole firm or Equity Value Multiples which focus strictly on shareholder value.
Below are the most important ones.
EV/EBITDA
This is the most widely used Enterprise Value multiple in investment banking. That’s because EBITDA lets you compare the underlying profitability of businesses with very different financing choices, tax situations, or asset bases. It strips out:
Interest which depends on capital structure
Taxes which depend on jurisdiction
D&A which is a non-cash charge
Since EBITDA ignores capital expenditures, it’s not ideal for capital-intensive industries like manufacturing, telecom, or energy.
EV/EBIT
EBIT stands for Earnings Before Interest and Taxes. It’s another Enterprise Value multiple and it’s similar to EBITDA but includes Depreciation and Amortization. This makes it better suited for companies where depreciation is a real, ongoing economic expense that cannot be ignored. So, EV/EBIT gives a more honest picture of profitability than EV/EBITDA does in capital-intensive businesses like manufacturing or shipping.
EV/Revenue
Generally, revenue multiples are used when companies are not yet profitable — which is very common for early-stage or high-growth technology and biotech companies. EV/Revenue is also used when comparing companies across different stages of profitability, or as a quick sanity check alongside EBITDA multiples.
The limitation is that revenue doesn't tell you anything about how efficiently the company converts sales into profit. So, two companies at the same revenue multiple could have wildly different profitability profiles.
Price-to-Earnings (P/E)
The P/E ratio is one of the most recognized equity value multiples in finance. It compares a company's stock price to its earnings per share (EPS). Or the company's equity market cap to its net income. Since it uses net income, which is after interest payments, P/E is affected by how a company is financed. Two companies with identical operations but different debt levels will have different P/E ratios. This makes P/E less clean for cross-company comparisons in situations where capital structure varies widely.
So, P/E is more common in equity research and in conversations with public market investors than in acquisitions. It’s mostly used for mature industries and financial institutions (banks/insurance).
Advantages and Limitations of Comparable Company Analysis
Like every other valuation method, comps has its pros and cons. Here are the most important.
Advantages of Comps Analysis
Market-Based and Current: It reflects real-time, objective public market sentiment and macroeconomic conditions.
Simplicity and Defensibility: CCA is easy to calculate and explain to corporate executives or clients who may not be deeply technical. Also, grounding analysis in widely accepted, publicly available data makes the resulting valuation easy to defend when challenged.
Benchmarking: It establishes a clear valuation range and helps instantly identify whether your target is currently trading at a premium or discount compared to its peers.
Speed and Simplicity: It is significantly faster and requires fewer long-term forecasting assumptions than complex intrinsic valuation methods like a Discounted Cash Flow (DCF) model.
Limitations of Comps
Depends on Peer Group Quality. If the comparables don’t share similar characteristics with the target, your valuation will be misleading. But there are also no perfect matches.
Market Conditions can Distort Results. If the market is experiencing a bubble or a severe downturn, the valuation multiples will also be skewed. So, you may overvalue or undervalue the target.
Ignores Company-Specific Factors: Comps values the company entirely based on the peer average, meaning it can fail to capture unique competitive advantages, synergies, or hidden operational risks.
Limited for private or unique companies. CCA works best when there are publicly traded peers to compare against. For private companies, niche businesses, or companies with unusual structures, finding meaningful comps can be extremely difficult, which limits how much confidence you can place in the results.
Comparable Company Analysis Example
Let’s say you want to value a mid-sized B2B software company using CCA operating in EMEA. The company has LTM Revenue of $100 million and LTM EBITDA of $20 million.
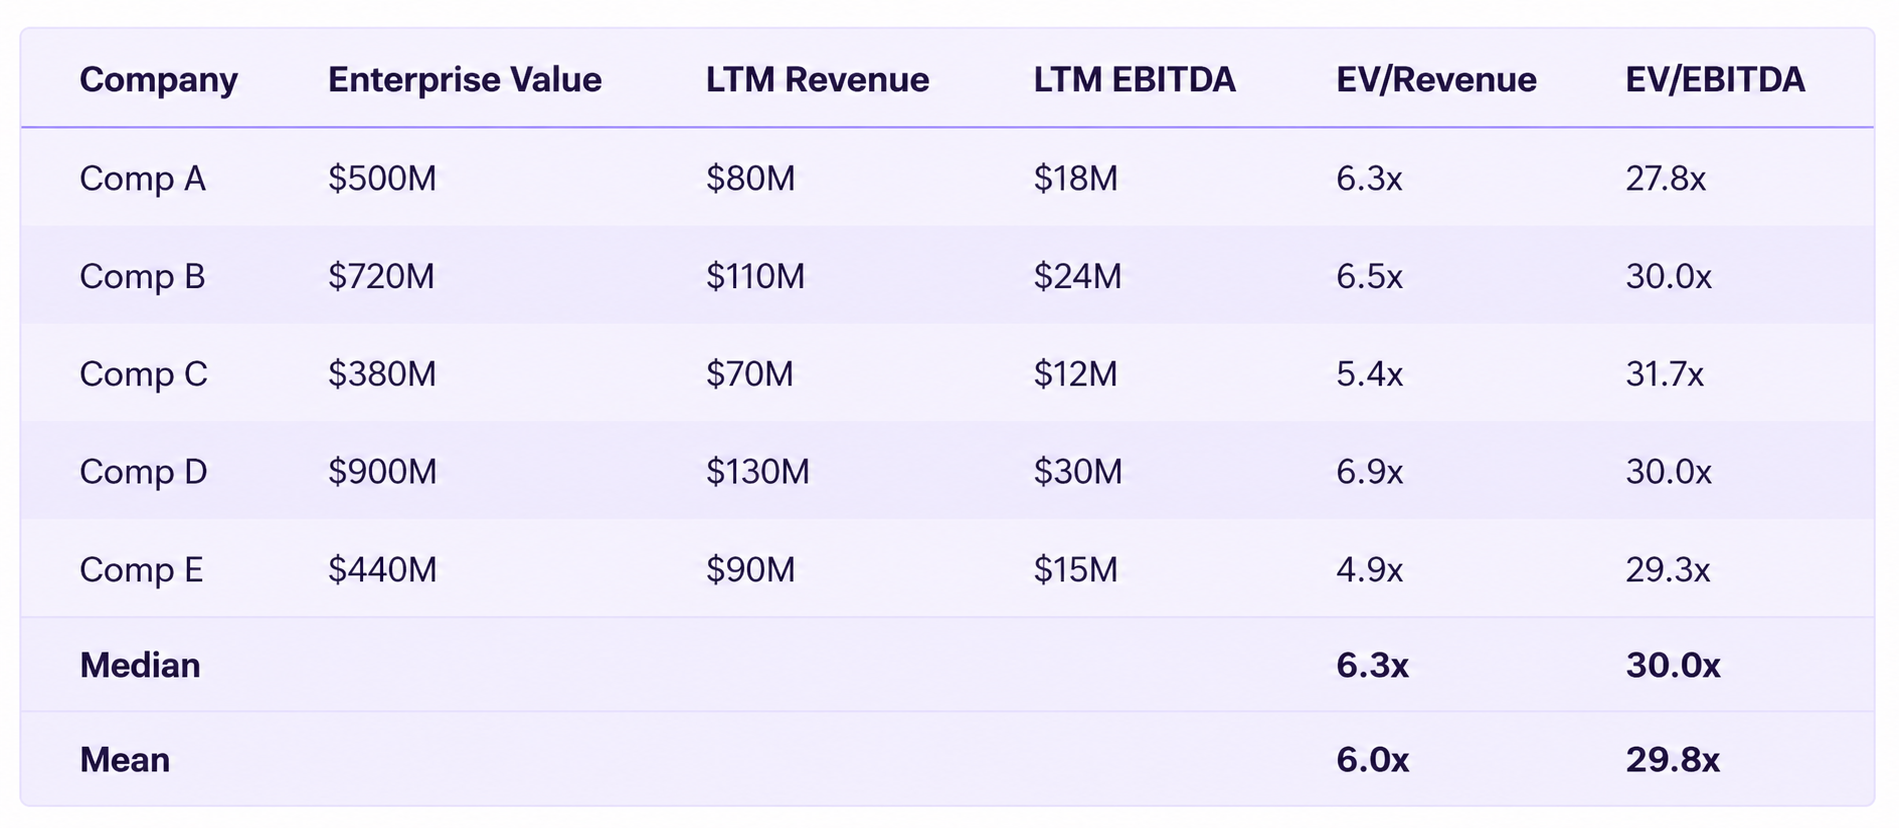
The first step is to build a peer group. Identify five publicly listed B2B software companies that operate in emerging markets and are roughly comparable in size and business model. Let's call them Comp A through Comp E. Then pull LTM Revenue and LTM EBITDA for each company, along with their Enterprise Values from current market data.
Once the data is ready, calculate the multiples as shown below:
The next step is to apply the multiples and the target’s financials. Let’s use the median multiples in this case.
Using EV/Revenue: 6.3x × $100M = $630M implied Enterprise Value
Using EV/EBITDA: 30.0x × $20M = $600M implied Enterprise Value
The two methods give you a range of approximately $600M to $630M, which is the preliminary valuation range for the target on a standalone basis.
Common CCA Interview Questions
The most common Comparable Company Analysis (CCA) interview questions test your ability to select appropriate peers, standardize financial metrics, and apply valuation multiples. So, you can expect to answer questions on peer selection, multiple selection, relative vs intrinsic valuation, and Enterprise versus Equity value like the ones below.
1. When do you use P/E versus EV/EBITDA multiples?
Use P/E (Price-to-Earnings) when comparing companies with similar capital structures and tax rates, as it includes interest and debt. But use EV/EBITDA (Enterprise Value to EBITDA) when comparing companies with different capital structures, as it is a capital-structure-neutral metric.
2. Why do we use EBITDA instead of Net Income in valuation multiples?
EBITDA strips out interest, taxes, depreciation, and amortization, allowing you to compare the core operational profitability of companies without distorting differences in debt loads, capital expenditures, or tax jurisdictions.
Enterprise value is the price tag of a company or what it would cost to buy the entire business right away.
Conclusion
Comparable company analysis grounds valuation in what investors are paying for similar businesses unlike DCF that depends on assumptions about a company’s future. The dependence on current data and its simplicity is what makes it important across every major use case in investment banking, from setting an asking price in a sell-side deal to stress-testing fairness in an acquisition.
Mastering comps analysis requires knowing the steps, understanding peer group selection criteria, and choosing the most appropriate Enterprise Value or Equity Value multiple for the target. You must also know when to apply a premium or discount to the median and discuss pros vs cons to ace comps interview questions.
Here Are More Interesting Articles!
Merger Model: How It Works, Example & Interview Questions
Key Figures & Terms
M&A transactions require a thorough analysis of how merging companies will affect the financial health of the combined business once a deal closes. To do such analysis, bankers use a merger model. It covers standalone forecasts of income statements, total deal costs, transaction structure, and combined financials to find out whether the acquirer ends up in a stronger or weaker financial position than before.
Read on to understand the key components of an M&A merger model, get a step-by-step breakdown of how to build a merger model, and walk through a simple merger model example.
When a company wants to buy another business, they always ask, “How much is it worth?” To find the answer, investment bankers mostly use three popular valuation methods: Comparable Company Analysis, Discounted Cash Flow, and Precedent Transactions Analysis.
Each one answers that same question but gets there in a different way. For this guide, we will focus on Precedent Transactions Analysis (PTA) which looks at what past buyers actually paid for similar companies to determine the worth of the target.
Read on to understand how PTA works, why it’s important in M&A, how it compares to DCF and Comparable Company Analysis, and what questions interviewers tend to ask about it.