The Dividend Discount Model (DDM) is an income-based valuation method used to estimate the fair value of a company’s stock. It assumes that the value of a stock today equals the sum of all its future dividend payments, discounted back to their present value. By focusing on dividends as the key return to shareholders, the DDM directly links a company’s payout policy to its valuation.
Within the broader landscape of valuation models, the DDM is part of the income approach, alongside methods like the Discounted Cash Flow (DCF) analysis or the Gordon Growth Model (GGM). Unlike market-based valuation approaches that rely on relative comparisons, the DDM seeks to determine a company’s intrinsic value by analyzing fundamentals and the time value of money.
The DDM is founded on a fundamental financial principle: a dollar today is worth more than a dollar tomorrow. This is due to the time value of money which asserts that money accessible now is worth more than the same amount in the future because of its potential earning capacity and other factors like inflation.
There are different variations of the DDM. However, the basics of the model requires an analyst to forecast or determine the following:
1) Current dividend payment
This is obtained from the company’s historical data or upcoming announcements.
2) Expected annual rate of return or discount rate
This is the investor's required return for taking on the risk of investing in that particular stock. It’s commonly calculated using the Capital Asset Pricing Model (CAPM) method. Another method is using the Cost of Equity component of the Weighted Average Cost of Capital (WACC) formula.
3) Annual dividend growth rate
This is the rate at which a company’s dividend payments are expected to increase each year; an essential input for the Dividend Discount Model. For instance, if dividends are expected to rise from $1.00 to $1.05 over a year, the growth rate is 5%. Estimating this rate can be tricky.
Analysts might look at a company’s historical dividend increases, calculate an average using the compound annual growth rate (CAGR), refer to industry benchmarks, or use the sustainable growth rate formula: g = Retention Ratio × Return on Equity (ROE). The retention ratio is the portion of net income the company keeps (i.e., not paid out as dividends), and it reflects how much profit is reinvested into the business.
Combined with ROE, this method estimates how fast dividends can grow based on how much profit the company retains and how efficiently it generates returns on equity.
Types of the Dividend Discount Model
There are three main types of DDM, namely, the Gordon Growth Model, Zero-Growth DDM, and Multi-Stage DDM. The company’s maturity and historical dividend payout patterns determines the right method to use. Below is an overview of each.
Gordon Growth Model
The Gordon Growth Model, named after Myron J. Gordon, who popularized it, is the most basic and popular version. It assumes dividends will grow at a constant rate indefinitely. That assumption highlights one of the model's limitations. In reality, companies go through different growth phases, which is why more complex versions of the model exist to account for varying growth rates.
The general formula for the Gordon Growth Model DDM is:
P = D₁ ÷ (r - g)
Where:
P = Intrinsic value of the stock (price)
D₁ = Expected dividend in the next year
r = Required rate of return (discount rate)
g = Dividend growth rate (the rate at which dividends are expected to grow annually)
Zero-Growth Dividend Discount Model
This model is applicable when dividends are expected to remain the same, that is, no growth. Consequently, the stock price would be calculated as follows:
Formula: P = D ÷ r
Where:
P = Intrinsic value of the stock (price)
D = Expected dividend in the next year
r = Required rate of return (discount rate)
Multi-Stage Dividend Discount Model
The multi-stage DDM was developed to account for the fact that companies often experience different growth phases. It’s used when dividend growth rates are expected to change over time. For example:
High growth in the short term, like 10% for 5 years
Stable growth afterward, for instance 3% indefinitely
There are two major variations of the multi-stage DDM, including:
Two-Stage Model: Assumes an initial period of high growth followed by a stable, lower growth rate indefinitely.
Three-Stage Model: Incorporates an initial high-growth phase, a transition period, and a final stable growth phase.
Common Dividend Discount Model Interview Questions
We’ve compiled some of the most common Dividend Discount Model interview questions. They will help you understand the type of questions asked in finance interviews around DDM, and help you practice to build up confidence.
1. Calculate the intrinsic value of the stock.
Let’s say a company currently pays an annual dividend of $2 per share, and analysts expect dividends to grow at 4% per year. If the required return on investment is 10%, what’s the intrinsic value of the stock?
If the stock is currently trading below $34.67, it may be undervalued. If it’s priced higher, it could be overvalued.
2. What makes a firm a good candidate for Dividend Discount Model valuation?
A firm is a good candidate for Dividend Discount Model (DDM) valuation if it possesses the following characteristics:
A long and predictable history of paying dividends
Stable and established business in mature industries
Clear and consistent dividend policy
Predictable growth rate
Industry Examples: Utilities, mature consumer staples companies (like beverage or food companies), and some financial institutions (like banks) are often good candidates due to their stable cash flows and consistent dividend payouts.
3. What’s the difference between Multi-Stage DDM and Gordon Growth Model (GGM)?
The Gordon Growth Model (GGM) assumes dividends grow at a constant annual rate indefinitely.
In contrast, multi-stage DDM allows for different dividend growth rates over time, often beginning with higher growth and progressing to a steady, lower growth rate. This makes it more flexible for companies with evolving dividend policies.
4. What’s the difference between the Dividend Discount Model (DDM) vs Discounted Cash Flow (DFC) valuation?
Both Dividend Discount Model (DDM) and Discounted Cash Flow (DCF) are intrinsic valuation methods that determine a company's worth by discounting future cash flows. The key difference is in what "cash flow" they focus on.
DDM concentrates on the present value of future dividend payments while DCF utilizes the present value of future free cash flows.
5. Why is the Dividend Discount Model particularly appropriate for valuing banks compared to other companies?
The Dividend Discount Model is especially suitable for valuing banks for several key reasons:
First, banks maintain stable and predictable dividend payments due to their mature business models and regulatory requirements to maintain capital adequacy. This consistency in dividend distribution aligns perfectly with DDM's core assumption of predictable future cash flows.
Second, banks often distribute a significant portion of their earnings as dividends rather than reinvesting for growth. This high payout ratio makes dividends a meaningful representation of the cash returns to shareholders.
Third, banks' capital structures are heavily regulated, limiting their ability to retain excessive capital. Instead, they return excess capital to shareholders through dividends, making these payments a critical component of shareholder value.
Finally, traditional valuation methods like DCF usingfree cash flow are problematic for banks because distinguishing between operating and financing activities is difficult when debt is essentially a "raw material" for banks. The DDM bypasses this issue by focusing directly on shareholder returns.
6. Can you explain how the Residual Income Model relates to the Dividend Discount Model, and when you might prefer one over the other for bank valuation?
The Residual Income Model (RIM) and DDM are mathematically equivalent under certain conditions but offer different practical advantages for bank valuation.
The RIM starts with a bank's current book value and adds the present value of future "excess returns" (returns above the cost of equity). Specifically, each year's excess return is calculated as (ROE × Book Value) - (Cost of Equity × Book Value). This effectively captures value creation above the required return.
The relationship between RIM and DDM comes from the clean surplus accounting relationship: both models will yield identical valuations when assumptions are consistent. However, I would prefer RIM over DDM when:
A bank retains significant earnings with low near-term dividend payouts but is generating strong ROE. RIM better captures this value creation even before it translates to dividends.
Analyzing banks in high-growth markets where current dividends are minimal but book value is growing rapidly.
Evaluating banks undergoing regulatory capital building phases with temporarily restricted dividends.
However, I would prefer DDM when:
The bank has a very stable, mature business with consistent dividend policies.
Dividend payments are expected to be the primary mechanism for shareholder returns rather than stock price appreciation from book value growth.
There are concerns about the reliability of reported book values or ROE figures due to accounting complexities.
👉 In our Case Library, you’ll also find valuation exercises to help you practice applying the Dividend Discount Model and other models.
Case Library
Discover more than 200 practice cases for every level and case type.
The Dividend Discount Model (DDM) works by calculating the "present value" of all a company's expected future dividend payments. You estimate future dividends and then discount them using a "required rate of return". The total of these discounted future dividends gives you the stock's intrinsic value. If this value is higher than the current market price, the stock might be undervalued.
The model is based on the assumption that a stock's true worth today is the sum of what you expect to receive from it in the future, discounted back to today's value. So, if a company is expected to pay dividends in the future, the DDM discounts these future payments back to their present value. The sum of these present values is what the model estimates the stock is worth today.
The Gordon Growth model is the most basic version, used when dividends are expected to grow at a constant rate forever. There’s also a zero-growth DDM, and multi-stage DDM.
Let's Move On With the Next Articles:
Gordon Growth Model (GGM)
Valuation Models
The Gordon Growth Model (GGM) is a simplified version of the Dividend Discount Model (DDM) that estimates the intrinsic value of a stock based on its future dividends. What sets the GGM apart is its core assumption: dividends will grow at a constant rate indefinitely. This makes the model straightforward to apply, as it avoids the complexity of accounting for varying growth stages.
Because of this focus on perpetual, steady growth, the GGM is particularly suited for mature companies with stable earnings and predictable dividend policies. While it may not capture the dynamics of high-growth or volatile firms, it remains one of the most widely used tools for valuing dividend-paying stocks in practice.
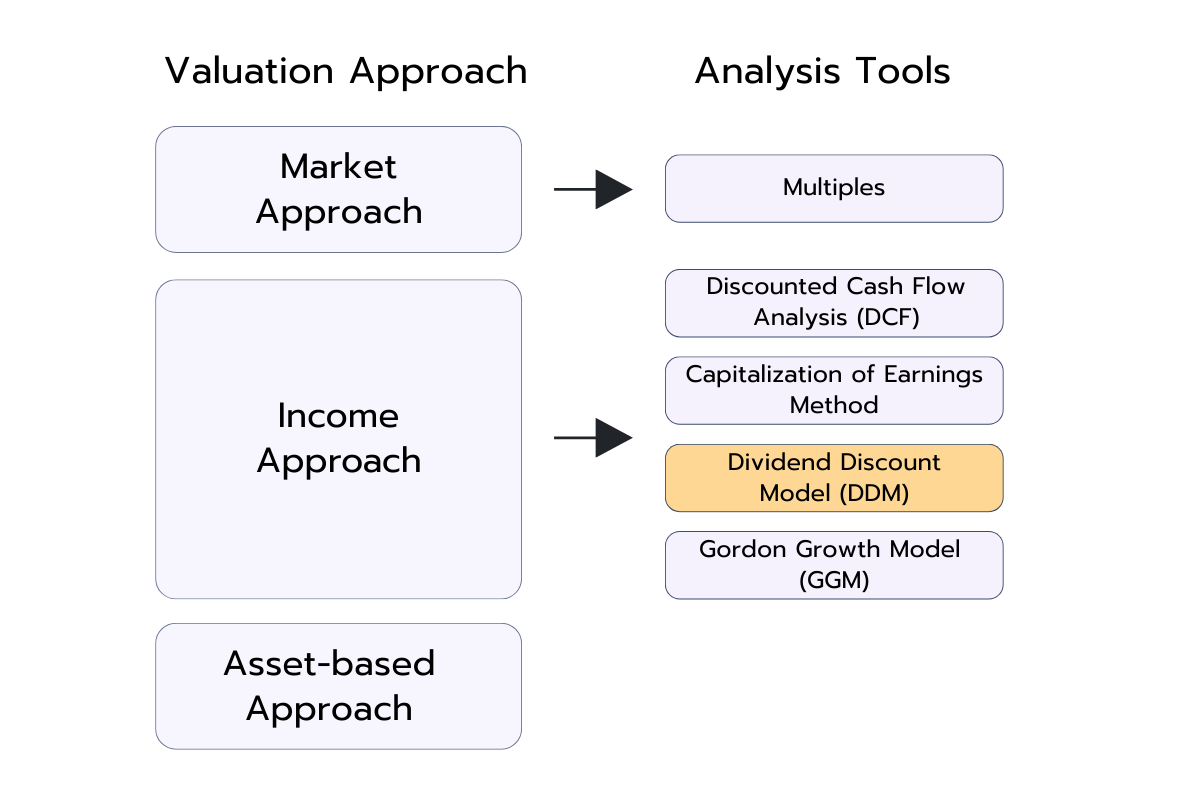
[Diagram showing valuation approaches and related analysis tools. Market-based approach links to Multiples. Income-based approach links to Discounted Cash Flow (DCF), Capitalization of Earnings, Dividend Discount Model (DDM), and Gordon Growth Model (GGM). Asset-based approach is listed but not linked to a specific tool.]
In company valuation, the Capital Asset Pricing Model (CAPM) is a method used to calculate the cost of equity. The cost of equity is the return a company requires to compensate its equity investors or shareholders for the risk they undertake by investing their capital. There are other methods to estimate the cost of equity, such as the dividend capitalization model, but CAPM is the most popular one.
The CAPM formula also helps investors figure out what return they should expect from an investment, based on how risky it is. It’s like a “fair deal” calculator for investments. Below is an overview of the CAPM formula, its assumptions, and common interview questions related to it.
The Residual Income Model (RIM), similar to the Dividend Discount Model (DDM) or the Discounted Cash Flow (DCF) approach, is a method of company valuation. Unlike these models, the RIM focuses on whether a company earns profits that exceed its cost of equity.
This shows whether a company truly creates value for its shareholders and helps investors assess whether a stock is overvalued or undervalued.