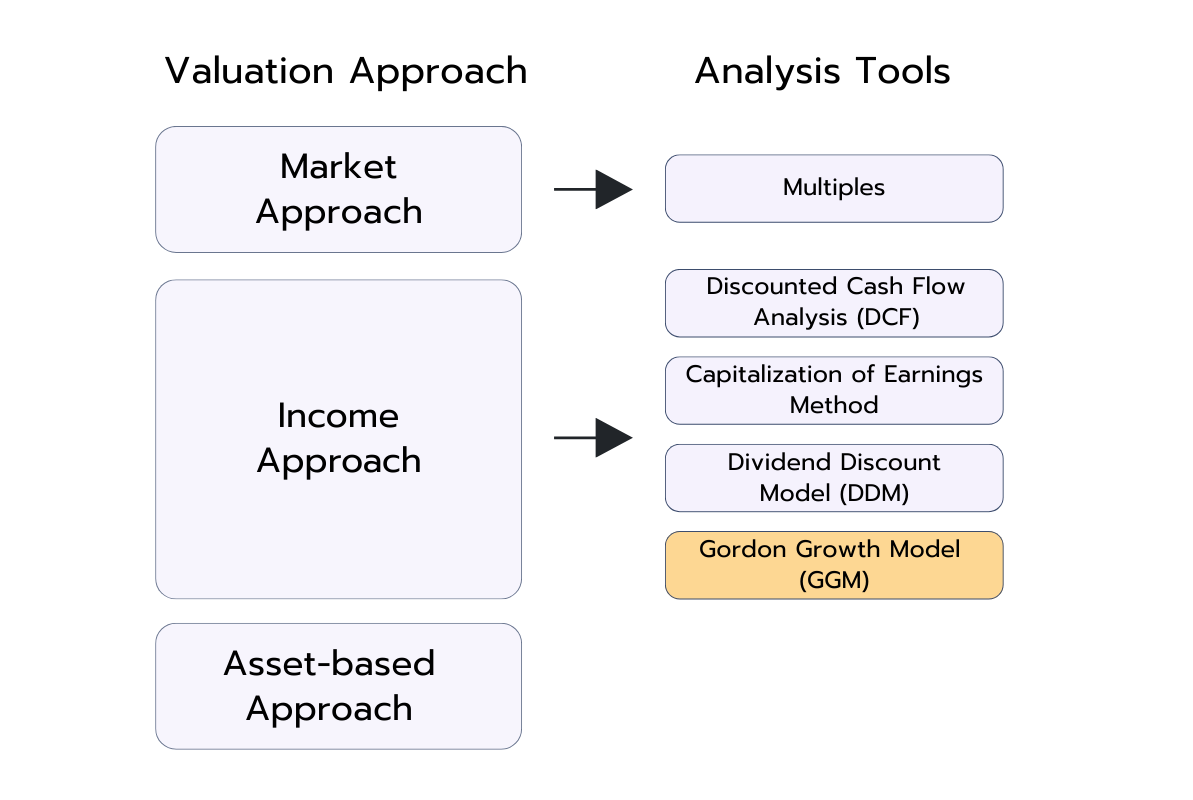
The Gordon Growth Model (GGM) is a simplified version of the Dividend Discount Model (DDM) that estimates the intrinsic value of a stock based on its future dividends. What sets the GGM apart is its core assumption: dividends will grow at a constant rate indefinitely. This makes the model straightforward to apply, as it avoids the complexity of accounting for varying growth stages.
Because of this focus on perpetual, steady growth, the GGM is particularly suited for mature companies with stable earnings and predictable dividend policies. While it may not capture the dynamics of high-growth or volatile firms, it remains one of the most widely used tools for valuing dividend-paying stocks in practice.
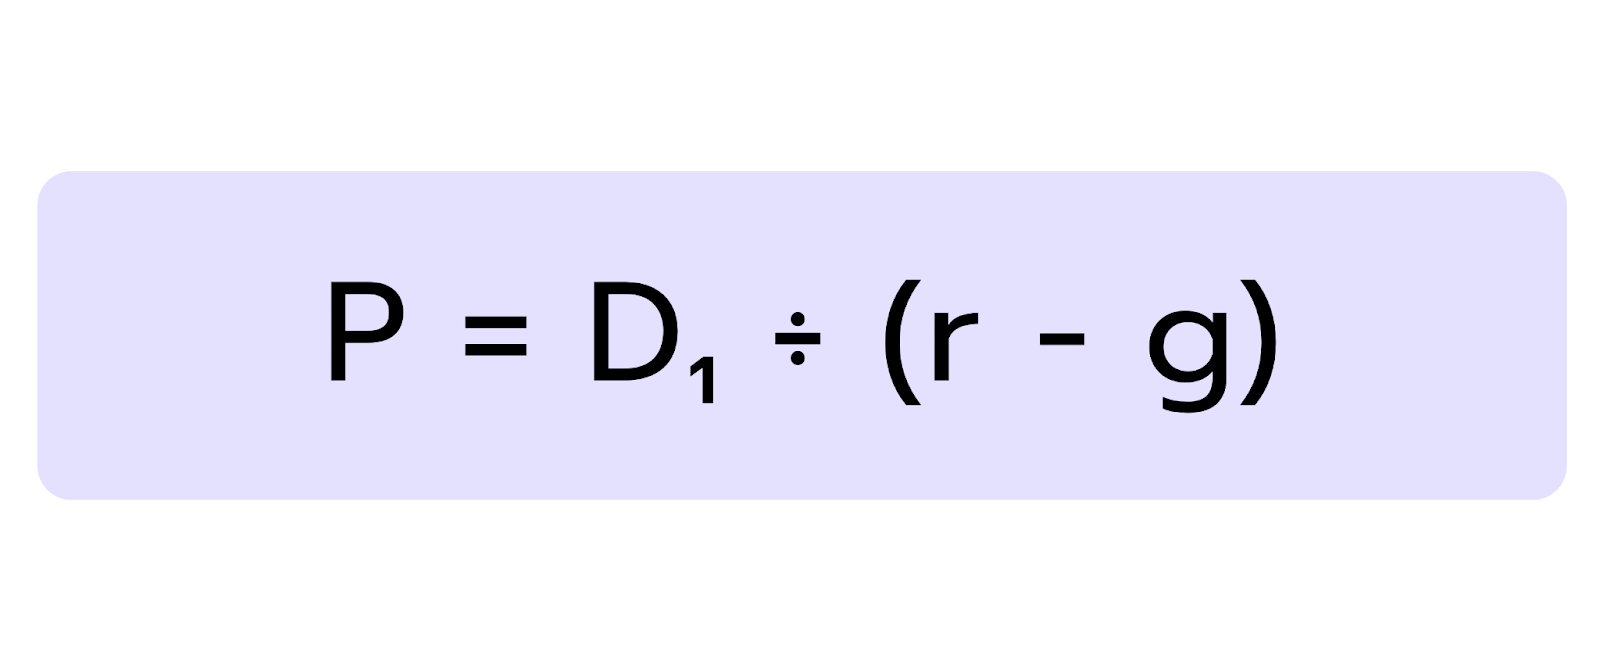
The GGM formula provides a way to calculate a stock’s intrinsic value using just three key inputs. It assumes that dividends will increase at a steady rate indefinitely. For firms with consistent dividend growth, the GGM can deliver a quick and insightful estimate of fair value.
r is the required rate of return (or discount rate)
g is the expected constant growth rate of dividends
Let’s break that down. The Gordon Growth Model values a stock by taking the expected dividend one year from now and dividing it by the difference between the required rate of return and the dividend growth rate. Each of these inputs needs to be estimated carefully.
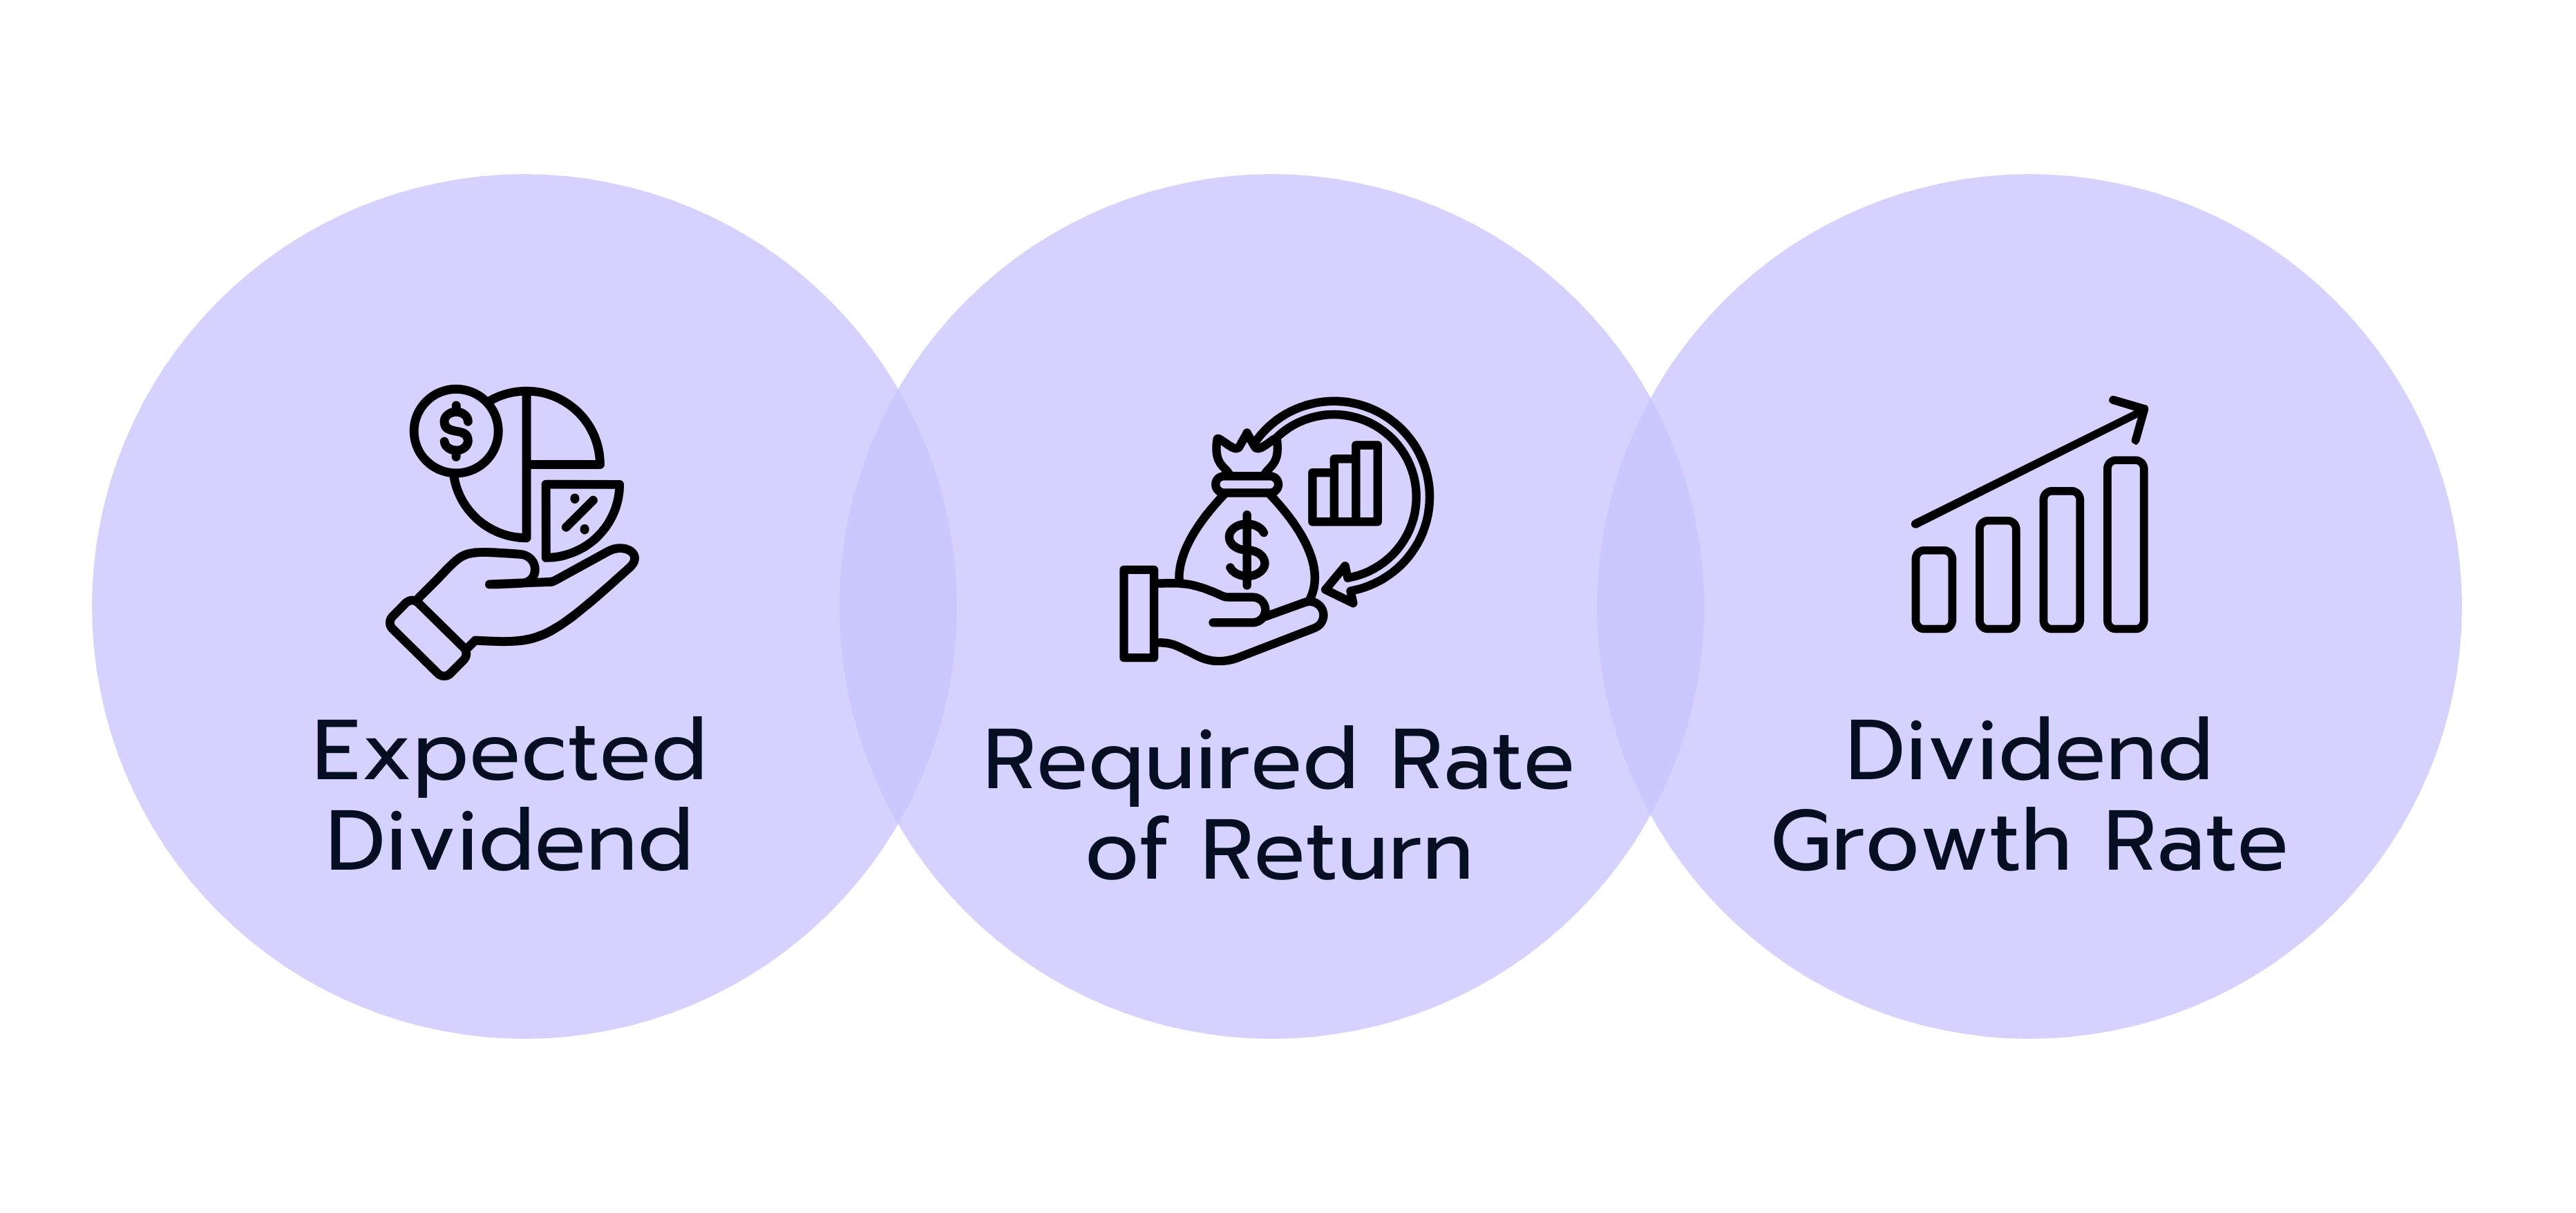
Input Factors of the GGM
1. Expected Dividend (D₁):
This is the dividend the company is projected to pay in the next year. If the most recent dividend was, for example, $1.90 and dividends are expected to grow by 5%, then next year's dividend (D₁) would be $1.90 × (1 + 0.05) = $2.00.
This estimate is typically based on historical dividend trends, management guidance, or consensus analyst forecasts.
2. Required Rate of Return (r):
This is the return investors demand for holding the stock, given its risk profile. A common way to estimate this is using the Capital Asset Pricing Model (CAPM), which considers the risk-free rate (such as a 10-year government bond yield), the stock’s beta (its volatility relative to the market), and the expected equity risk premium.
For example, if the risk-free rate is 3%, the stock's beta is 1.2, and the equity premium is 4%, then r = 3% + 1.2 × 4% = 7.8%.
3. Dividend Growth Rate (g):
This is the rate at which dividends are expected to grow each year, indefinitely. It can be estimated using historical dividend growth averages, projected earnings growth, or payout ratio trends. Analysts may also use qualitative inputs like industry outlook or company expansion plans to refine this estimate.
Understanding how each input affects the result is key. If the growth rate increases, the denominator (r − g) becomes smaller, which increases the valuation. Likewise, if the required return decreases, say, due to lower perceived risk, the valuation also rises. This relationship highlights why accurate and realistic assumptions are essential when using the model.
When using the GGM, always keep in mind that it works best for companies that operate in mature industries, exhibit steady long-term growth, and follow stable, predictable dividend policies. In these cases, the model’s assumptions align closely with the company’s actual financial behavior, making its valuation more reliable.
Common Gordon Growth Model Interview Questions
Understanding the Gordon Growth Model conceptually is one thing, but being able to explain and apply it under pressure in an interview is another. Below are some typical questions you might encounter, along with clear explanations and sample answers to help you prepare with confidence.
1. Walk me through the Gordon Growth Model.
The Gordon Growth Model is a way to value a company based on its future dividend payments, assuming they grow at a constant rate indefinitely. The formula is P = D₁ ÷ (r − g), where P is the value of the stock, D₁ is the expected dividend next year, r is the required rate of return, and g is the expected dividend growth rate. It simplifies valuation by focusing on dividends as a proxy for cash flow.
2. What are the assumptions behind the Gordon Growth Model?
The Gordon Growth Model assumes that dividends grow at a constant rate forever, that the required rate of return is greater than the growth rate, and that the company pays dividends. It also assumes a stable business environment without significant changes to capital structure, payout policy, or risk profile.
3. Can you present a numerical example using the GGM?
Let's say a company is expected to pay a dividend of $2.00 next year. The required rate of return for investors is 8%, and the dividend is expected to grow at a constant rate of 3% per year. Using the Gordon Growth Model, the formula would look like this:
Based on this calculation, the stock would be valued at $40.00 per share.
👉 Looking to improve your calculation speed? Our Mental Math Tool helps you practice the fast, accurate maths commonly required in finance interviews.
Mental Math Tool
Train your mental math skills and compete with the community!
The main limitations of the Gordon Growth Model are its reliance on a constant growth rate and its focus on dividend-paying companies. It doesn’t work well for firms that don’t pay dividends, have variable dividend policies, or are in high-growth phases. It can also produce unrealistic valuations if the required return is close to the growth rate.
5. How would you adjust the Gordon growth Model if the dividend isn’t expected to grow at a constant rate?
You could use a multi-stage dividend discount model. For example, you might forecast dividends explicitly for a high-growth period, such as five years, and then apply the Gordon Growth Model to estimate the terminal value using a lower, stable growth rate.
👉 Want to put your skills to the test? Our Case Library includes valuation exercises ideal for practicing under interview conditions.
Case Library
Discover more than 200 practice cases for every level and case type.
The Gordon Growth Model is a foundational concept in finance that helps estimate the value of a company’s stock based on future dividends growing at a constant rate. It is particularly effective for stable, mature companies with reliable dividend histories.
The model’s strength lies in its simplicity and clarity, but it also comes with strong assumptions: constant growth, ongoing dividend payments, and a required rate of return greater than the growth rate.
While it may not be suitable for valuing high-growth or non-dividend-paying companies, the Gordon Growth Model remains a useful tool in your valuation toolkit. When applied thoughtfully and in the right context, it can help you build confidence in equity valuation and stand out in interviews.
Let's Move On With the Next Articles:
Capital Asset Pricing Model (CAPM)
Valuation Models
In company valuation, the Capital Asset Pricing Model (CAPM) is a method used to calculate the cost of equity. The cost of equity is the return a company requires to compensate its equity investors or shareholders for the risk they undertake by investing their capital. There are other methods to estimate the cost of equity, such as the dividend capitalization model, but CAPM is the most popular one.
The CAPM formula also helps investors figure out what return they should expect from an investment, based on how risky it is. It’s like a “fair deal” calculator for investments. Below is an overview of the CAPM formula, its assumptions, and common interview questions related to it.
The Residual Income Model (RIM), similar to the Dividend Discount Model (DDM) or the Discounted Cash Flow (DCF) approach, is a method of company valuation. Unlike these models, the RIM focuses on whether a company earns profits that exceed its cost of equity.
This shows whether a company truly creates value for its shareholders and helps investors assess whether a stock is overvalued or undervalued.
The discounted cash flow (DCF) analysis is one of the most important valuation methods in finance. Among the commonly used valuation models, the DCF method belongs to the income-based approaches.
It complements market-based methods like multiples or transaction analyses as well as asset-based approaches like the net asset value. The DCF method is one of the most frequently used models in practice, especially in investment banking, private equity, and strategic corporate valuation.