Capital Asset Pricing Model (CAPM) Assumptions
CAPM works with a few assumptions that create the idealized world in which the model is theoretically sound. However, these assumptions don't always perfectly hold in the real world, which is a key reason why CAPM has its limitations. The assumptions include:
- Investors are rational and risk-averse. So, they make decisions based on expected returns.
- Investors hold well-diversified portfolios. Therefore, they are only concerned with systematic risk.
- Investors have homogeneous expectations on future returns and variances.
- There exists a risk-free asset available to all investors.
- The markets are perfectly efficient.
Common CAPM Related Interview Questions
The CAPM is a common topic in many finance interviews – especially when it comes to valuation, capital structure, or risk assessment. Since questions about the Capital Asset Pricing Model frequently come up during the recruiting process, it’s well worth making sure you understand the concept thoroughly. Below, you’ll find typical interview questions that are often asked in this context – or in a similar form.
1. Is CAPM the same as cost of equity? How do you calculate the cost of equity?
No. CAPM is the method or formula, and the cost of equity is what you get when you apply that method.
CAPM is the most widely used method to calculate the cost of equity, and the formula is:
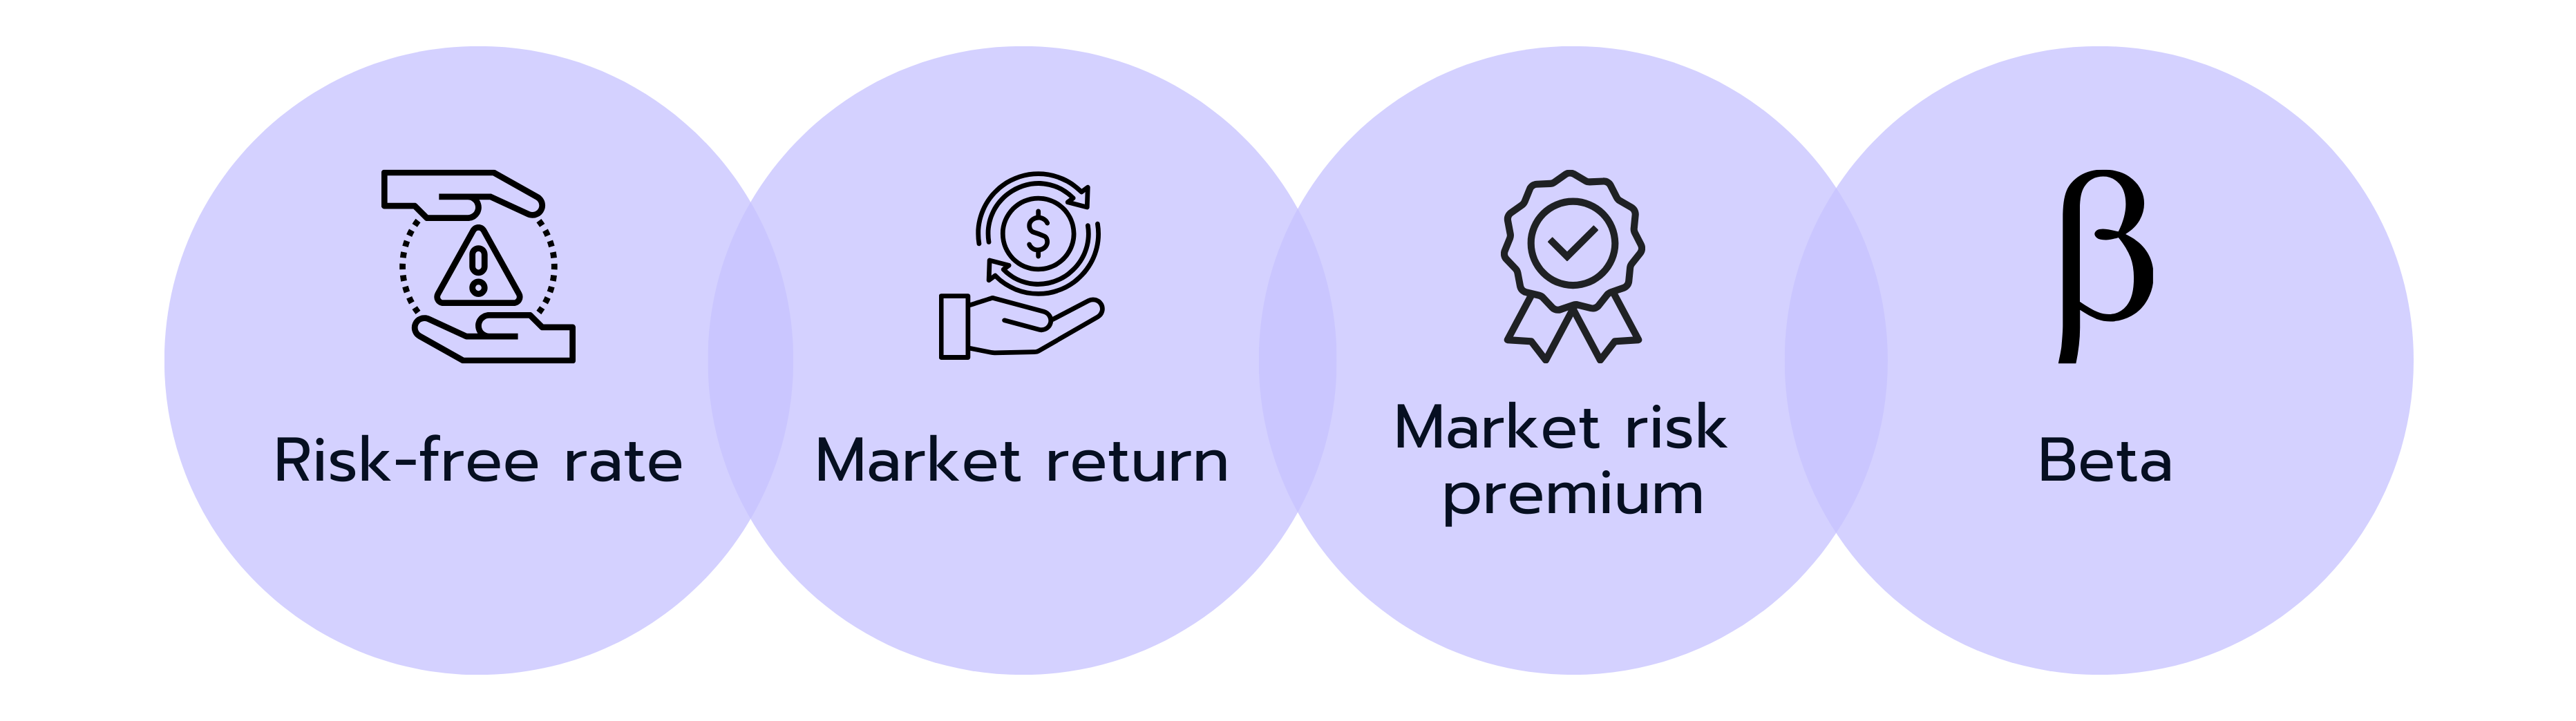
Cost of Equity=Risk-Free Rate+β×(Market Rate of Return−Risk-Free Rate)
Where:
- The Risk-Free Rate is the return on a theoretically risk-free investment, such as government bonds.
- Beta (β) measures the investment’s volatility relative to the overall market.
- The Market Rate of Return is the expected return of the market portfolio.
- The term (Market Rate of Return−Risk-Free Rate) is called the market risk premium.
2. How do you get Beta when calculating the Cost of Equity?
The steps for determining the appropriate Beta for a Cost of Equity calculation are:
- Gather Beta values for several comparable companies, typically from financial data services like Bloomberg.
- Un-leverage each of these Betas to remove the effect of the comparable companies' debt structures.
- Calculate the median value of this set of un-levered Betas.
- Re-lever this median Beta using your own company's capital structure (debt-to-equity ratio).
This re-levered Beta is what you'll use in your Cost of Equity formula. The mathematical process involves these formulas:
Un-Levered Beta = Levered Beta ÷ [1 + ((1 - Tax Rate) × (Total Debt/Equity))]
Levered Beta = Un-Levered Beta × [1 + ((1 - Tax Rate) × (Total Debt/Equity))]
3. What's the purpose of un-levering and re-levering Beta?
This process ensures a direct and fair comparison between companies. When you obtain Beta values from financial databases, these figures already incorporate the effects of each company's existing debt level.
Since different companies have varying capital structures, we need to isolate their inherent business risk independent of financing decisions. Un-levering each Beta helps to assess how inherently risky each business is regardless of its debt-to-equity ratio.
Once we've determined the appropriate un-levered Beta for our analysis, we then need to re-lever it using our specific company's capital structure. This final step ensures the Beta we use in our Cost of Equity calculation accurately reflects our company's true risk profile, properly accounting for both its business risk and financial leverage.
4. How is CAPM related to the Weighted Average Cost of Capital (WACC)?
CAPM is commonly used to calculate the cost of equity component in WACC.
5. What is the difference between systematic and unsystematic risk? How does CAPM treat these?
Systematic risk is the market-related risk that cannot be diversified away, no matter how many different assets you hold in your portfolio. It includes interest rate changes, inflation, recessions, and geopolitical events.
Unsystematic is the risk associated with a specific company, industry, or asset. It can be reduced or eliminated by diversifying the investment portfolio across different, uncorrelated assets. Examples include labor strikes within a company, firm-specific news, and technological obsolescence affecting a specific industry.
The Capital Asset Pricing Model (CAPM) makes the assumption that investors are only compensated for bearing systematic risk, which they can’t avoid.
6. What are the limitations of CAPM?
Even though the CAPM is widely used in practice, there are several valid criticisms of the model. It relies on theoretical assumptions that rarely hold true in the real world. These include, for example, the idea of perfectly efficient markets or the assumption that all investors act purely rationally.
In addition, the CAPM only accounts for market risk, as reflected by the beta factor. Other important influences – such as company-specific risks or broader macroeconomic developments – are not considered.
Another challenge lies in the uncertainty of the input values. Both beta and the market risk premium cannot be precisely determined and must be estimated in practice, which makes reliable calculations more difficult. On top of that, beta is not a stable figure and can vary significantly over time, further limiting the model’s accuracy and reliability.
Key Takeaways
The CAPM is a key method for calculating the cost of equity and is regularly used in company valuations and investment decisions. The formula combines the risk-free rate, the expected market return, and the beta factor, which measures an investment’s risk relative to the overall market. It’s important to determine beta realistically – by unlevering it and then adjusting it to reflect the company’s capital structure (relevering).
Although the model is based on theoretical assumptions that don’t always hold in reality, it remains widely used in practice. That’s why finance interviews often go beyond the formula itself and focus on whether you can assess risk and explain financial relationships clearly. If you have a solid grasp of CAPM, you’ll have a real advantage in the recruiting process.