An income statement, also known as a profit and loss statement (P&L), is one of the three primary financial statements alongside a balance sheet and cash flow statement. Together, they give a report of a company’s financial health and performance over a specific period.
But the income statement is often the starting point for financial analysis and valuation work. So, as you prepare for finance interviews, you must master the income statement including what it is, its structure and purpose, key concepts and terminology, and effects of different transactions. This guide will cover all that plus the connection between the three statements and common interview questions about the income statement.
The income statement is a financial report that summarizes a company’s revenues, expenses, and profits over a particular period, typically a quarter or a year. The purpose of this report is to answer the question: “How much money did the company make or lose during this period?”
As such, finance professionals, management, and investors use the income statement to assess a company’s ability to generate profit, manage costs, and sustain growth.
Structure of the Income Statement
There are two common types of income statements: the single step and the multi step income statement. They differ in how detailed the revenues and expenses are presented.
An income statement has three main sections: Revenue, Expenses, and Profit or Loss. If it’s expressed in a formula, the simplest form is:
Revenue - Expenses = Net Income
Some companies, especially small businesses, use this basic formula to create a single-step income statement. This format takes total revenue and subtracts the total expenses. It’s easy to understand but doesn't give you much detail about different types of income and expenses.
The other structure is known as a multi-step income statement, and it’s common among large and public companies. The formula is still the same but the structure breaks everything down into stages. Instead of one big calculation, it shows you several smaller calculations that build on each other:
Step 1: Revenue - Cost of Goods Sold = Gross Profit
Step 2: Gross Profit - Operating Expenses = Operating Income
Step 3: Operating Income - Non-Operating Expenses = Net Income
This multi-step method helps to understand different aspects of the business. For instance, the gross profit tells you if the company is good at making and selling its products, operating income shows if the company runs its day-to-day operations efficiently, and net income tells you the final result after everything, including taxes and interest.
What Are the Most Important Elements in the Income Statement?
From the overall structure, you can tell the most crucial elements of the income statement are revenue, costs of goods sold, gross profit, operating expenses, operating income, and net income. They are referred to as line items, and it’s important to understand what each means as well as how it affects the statement.
Revenue (Top Line)
This is all the money a company receives from selling its products or services. It's called the "top line" because it literally appears at the top of the income statement. A company can choose to break down revenue into different segments or product lines. This section must also follow accounting rules about when to count the sale, even if payment comes later.
Cost of Goods Sold (COGS)
These are the direct costs associated with producing the goods or services sold by the company. COGS includes materials, labor, and manufacturing overhead directly tied to production. For instance, the COGS for a car manufacturer could include steel, engines, and assembly line workers.
Gross Profit
The gross profit is calculated as revenue minus COGS. It shows how much money remains after covering direct production costs. So, it tells you how profitable the company's core products or business is before considering other costs.
The figure is also used to calculate gross margin, which is gross profit divided by revenue. Gross margin is a key metric that analysts use to compare companies and assess pricing power and operational efficiency.
Operating Expenses
These are the costs of running the business that aren't directly tied to making products. They include selling expenses like advertising, general and administrative expenses(SG&A) like rent and salaries, research and development (R&D) funds, and depreciation and amortization. Operating expenses are useful in understanding a company's cost structure and management's ability to control costs while growing the business.
Operating Income (EBIT)
EBIT stands for Earnings Before Interest and Taxes. It represents the profit generated from core business operations, excluding financing and tax effects. This metric is particularly important for valuation purposes and comparing companies with different capital structures.
Formula: Gross Profit - Operating Expenses = Operating Income
Interest Expense and Income
These line items are also known as non-operating expenses and income. They are costs or losses and gains not related to the main business operations for instance:
Interest expense: cost of borrowing money
Interest income: money earned from investments
One-time charges: costs from closing a factory or settling a lawsuit
Net Income (Bottom Line)
This is the final profit or loss after all expenses, taxes, and other items. Essentially, it’s calculated as operating income minus interest and taxes. Once the net income is known, it’s used to calculate earnings per share (EPS) and is also the starting point for cash flow analysis.
EPS = (Net Income – Preferred Dividends) ÷ Weighted Average Common Shares Outstanding
How to Read and Interpret the Income Statement
The best way to read an income statement is to start from the topand work your way down, asking the right questions at each level. This top-down approach helps you understand not just how much profit a company makes, but also how it gets there. Each line reveals something important about the company’s business model, efficiency, and cost structure. By analyzing the statement step by step, you can uncover trends, assess performance, and spot potential red flags.
Let’s walk through this process using NVIDIA’s actual financial data as a real-world example. By applying each step to a leading tech company, you’ll see how to interpret the income statement in context. This approach makes the structure and key takeaways easier to grasp.
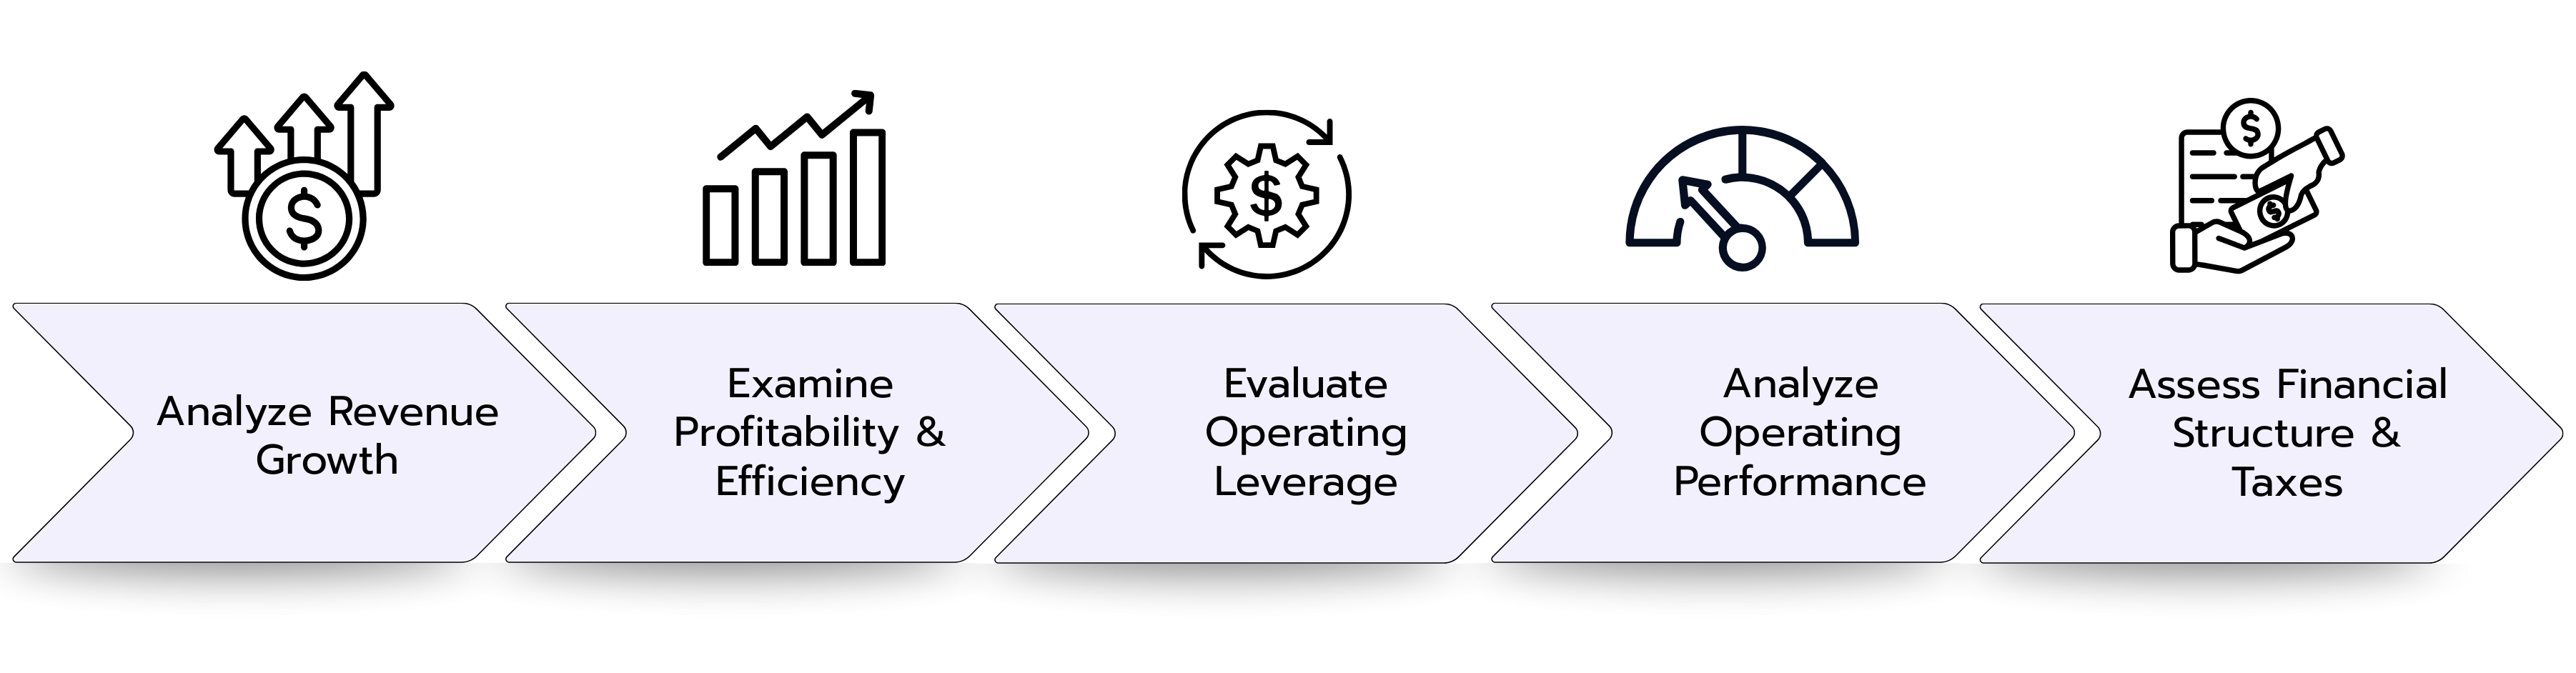
Step 1: Analyze Revenue Growth and Scale
The first line item we should read and interpret is revenue or sale. As you look at the figure, compare it to prior periods to see if there’s growth, decline, or stagnation. Then you can evaluate why that’s the case.
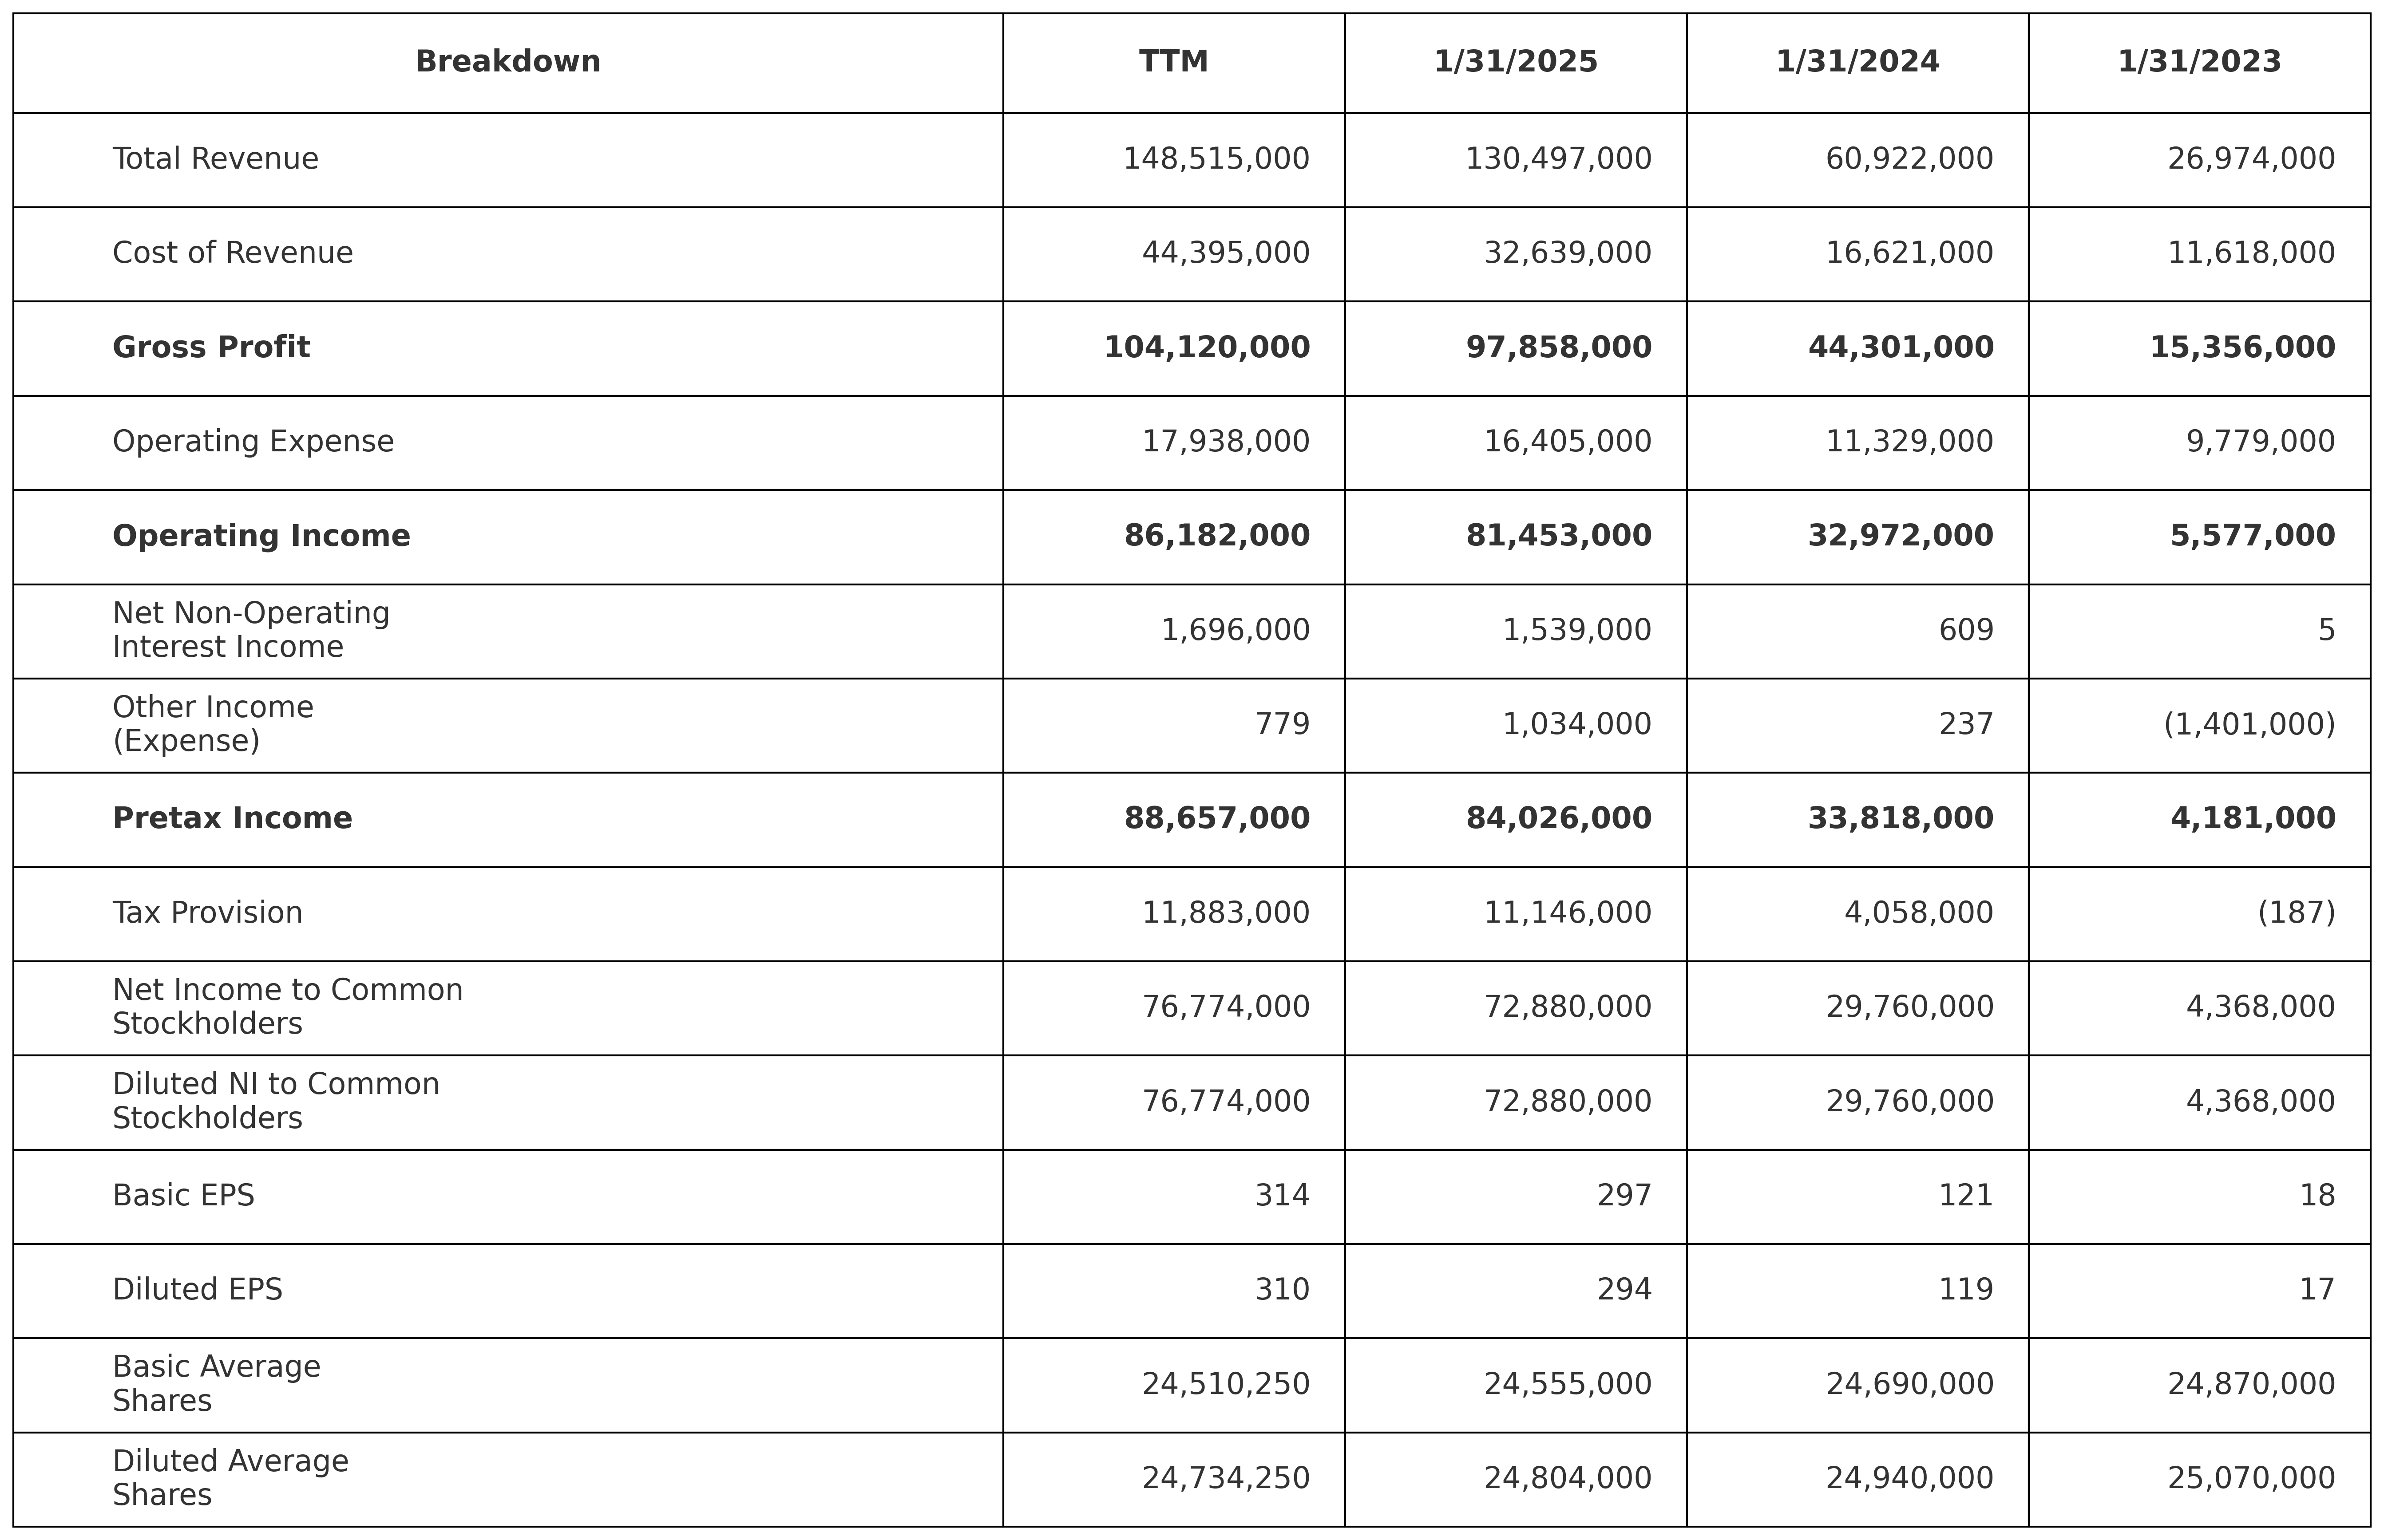
From NVIDIA's data, the total revenue was $130.50 billion in 2025, compared to $60.92 billion in 2024 and $26.97 billion in 2023. That’s an extraordinary growth of 114% from 2024 to 2025 and 126% from 2023 to 2024. So, what’s causing such explosive revenue growth at NVIDIA? A simple research would tell us the AI boom is driving demand for their graphics processing units. However, such rapid growth also raises questions about sustainability. Can they maintain this pace, and what happens when growth inevitably slows?
Step 2: Examine Gross Profitability and Efficiency
Next, look at the relationship between revenue and cost of goods sold to understand the company's gross profitability. The question to ask here is: ”Is COGS rising faster or slower than revenue?” If it’s faster, that could hurt margins. Calculate the gross margin by dividing gross profit by revenue, and compare this metric across different time periods and against industry competitors. An improving gross margin over time suggests the company is becoming more efficient at producing its goods or has pricing power in the market.
NVIDIA's cost of revenue was $32.64 billion against $130.50 billion in revenue, yielding a gross profit of $97.86 billion. That’s an impressive gross margin of 75% ($97.86B ÷ $130.50B). Comparing this to previous years shows gross margins of 73% in 2024 ($44.30B ÷ $60.92B) and 57% in 2023 ($15.36B ÷ $26.97B). This means their COGS is slower than revenue growth, which is perfect.
Step 3: Evaluate Operating Leverage and Cost Control
For this step, pay attention to the operating expense section because it reveals how well management controls costs while investing in growth. Ask questions like: Are expenses under control? Any unusual increases?
For instance, NVIDIA's operating expenses were $16.41 billion in 2025, compared to $11.33 billion in 2024 and $9.78 billion in 2023. While these expenses are growing, they're growing much slower than revenue. Operating expenses were just 12.6% of revenue in 2025, down from 18.6% in 2024 and 36.3% in 2023. That’s operational leverage when a company grows revenue faster than costs. The fact that NVIDIA maintained relatively controlled expense growth while more than doubling revenue shows exceptional management execution and business model strength.
Step 4: Analyze Core Operating Performance
Operating income, or EBIT, is often considered the most important profitability metric because it shows how well the core business performs regardless of how it's financed or taxed. Calculate the operating margin by dividing operating income by revenue, and track this metric over time. A company with consistently improving operating margins is becoming more efficient and profitable in its core operations.
NVIDIA's operating income reached $81.45 billion in 2025, representing an operating margin of 62.4%. This compares to $32.97 billion (54.1% margin) in 2024 and $5.58 billion (20.7% margin) in 2023. That’s a sign of a company operating at peak efficiency with strong competitive positioning.
Step 5: Assess Financial Structure and Tax Management
Lastly, assess interest expenses and their relationship to the company's debt levels. High interest expenses relative to operating income might mean excessive leverage and financial risk. Similarly, examine the tax rate to ensure it's reasonable and consistent with expectations. Unusual tax rates might indicate one-time tax benefits or charges that could distort the true underlying profitability of the business.
NVIDIA has net interest income of $1.54 billion, meaning they earn more from investments than they pay on debt. This suggests a strong balance sheet with excess cash rather than financial leverage concerns. Their tax provision of $11.15 billion on $84.03 billion in pretax income is an effective tax rate of 13.3%, which is reasonable for a multinational technology company utilizing various tax optimization strategies.
Then of course you can tell from the net income whether the company made a profit or loss. Compare the figure to previous periods and competitors. For instance, a company might be profitable but weak compared to competitors, which could be due to strategic challenges.
Common Interview Questions About the Income Statement
Most interview questions about the income statement test whether you know what the report is all about. So, they’ll ask questions about definition and what happens if one or more items change. Interviewers also want to see if you understand how the income statement links to the balance sheet and cash flow statement. Here’s our selection of top questions to help you prepare for finance interviews.
1. Walk me through the income statement.
The income statement summarizes a company’s revenues, expenses, and profits over a specific period, such as a quarter or year. A standard income statement starts with total revenue earned from sales or services, then subtracts the cost of goods sold (COGS) to arrive at gross profit. After that, operating expenses such as selling, general and administrative expenses (SG&A), depreciation, and amortization are deducted, resulting in operating income. Then, non-operating items like interest expense and taxes are subtracted to finally arrive at net income, which is the company’s profit over the period.
2. Explain the three primary financial statements and their purposes.
The main three financial statements are the Profit & Loss Statement (P&L), Balance Sheet, and Statement of Cash Flows.
The P&L Statement tells us about a company’s profitability by subtracting expenses from revenue over a specific period. This gives the net profit or loss.
The Balance Sheet is a summary of what the company owns (Assets) including cash, inventory, and fixed assets, what it owes (Liabilities) such as loans and accounts payable, and the owners' stake (Equity). The standard equation is: Assets = Liabilities + Equity.
The Statement of Cash Flows starts with net profit from the income statement, makes adjustments for non-cash items and changes in working capital, then shows cash movements from operating, investing, and financing activities, resulting in the net change in cash position.
3. What are the key line items you'd find on the income statement?
4. If depreciation expense increases by $15, how would it affect the income statement?
If depreciation expense increases by $15, it would reduce the operating income on the income statement by $15 because depreciation is recorded as an operating expense. This, in turn, lowers the pre-tax income, tax expense, and net income.
5. What happens to the income statement if accrued wages increase by $15?
Accrued wages are recorded on the income statement as an expense, specifically under payroll or wage expenses. Ideally, the wage expense is recognized in the income statement for the period when the employees earned it, regardless of whether the cash has been disbursed.
So, a $15 increase in accrued wages would lower the operating income and the net income for that period by $15 before tax effects.
6. What is the difference between COGS and operating expenses (OpEx)?
COGS are the direct costs associated with producing goods or delivering services, such as raw materials and labor directly involved in production. Operating expenses (OpEx), on the other hand, are indirect costs related to running the company's daily operations, such as marketing, administration, rent, and utilities. The primary difference is that COGS is tied directly to production, while OpEx covers broader operational costs.
7. What are common profitability margins we get from the income statement?
Gross Margin: (Gross Profit / Revenue): It shows the percentage of revenue left after covering COGS.
Operating Margin: (Operating Income / Revenue): It indicates profitability after operating expenses.
Net Margin: (Net Income / Revenue): This reflects overall profitability after all expenses and taxes.
8. Why is the income statement important relative to other financial statements?
The income statement is important because it shows a company’s profitability over a period, explaining how revenue is transformed into net income. While the balance sheet provides an overview of financial position, and the cash flow statement shows cash inflows and outflows, the income statement is the primary measure of operational success and business performance. Investors and management use it to assess growth, profitability, and operational efficiency.
9. How does the income statement connect with the balance sheet and cash flow statement?
The three financial statements are interconnected through net profit from the P&L. The net profit figure from the income statement is used in the retained earnings section on the Balance Sheet and serves as the starting point for the Cash Flow Statement.
👉 Practice interview questions like these in our Case Library
Case Library
Discover more than 200 practice cases for every level and case type.
As you prepare for finance interviews, you need to understand the purpose of an income statement, its structure, components, key profitability metrics, the connection with other statements, and practical impacts of transactions on financials.
The key margins you should be able to calculate and analyze from the income statement are gross margin (gross profit ÷ revenue), operating margin (operating income ÷ revenue), and net margin (net income ÷ revenue). Higher margins mean better performance and profitability
Let's Move On With the Next Articles:
Balance Statement
Financial Statements
The balance sheet, also known as a statement of financial position, is one of the three most important financial statements. The other two are the income statement and statement of cash flow. Each has its purpose, but together they reveal the profitability, financial stability, and cash flow sustainability of a company.As for the balance sheet, it gives you a clear view of what the company owns, what it owes, and what belongs to its owners. If you’re preparing for finance interviews, it’s important to understand the parts of a balance sheet, how to read and interpret it, and the common interview questions around it. Read on to learn everything you’ll need to be well-prepared and confident.
The cash flow statement is one of the three most important financial reports used by companies, alongside the balance sheet and the income statement. It shows how actual cash flows develop within a business, so when and how much money flows in or out of the company. This provides direct insight into a company’s liquidity and its ability to meet financial obligations.Unlike the cash flow statement, the balance sheet and income statement are based on the accrual accounting principle. Under this approach, revenues and expenses are not recorded when cash changes hands but are instead assigned to the accounting period in which they are economically incurred.In contrast, the cash flow statement is based on actual cash movements, therefore serving as a powerful tool in financial analysis. By focusing on real cash flows, it enables analysts to cut through the complexity of accounting and assess whether a company is truly generating cash or rather burning it.
In finance, Mergers & Acquisitions (M&A) refers to the process of mergers and corporate takeovers, where companies are combined or acquired to achieve strategic growth, greater efficiency, or competitive advantages.In mergers and acquisitions (M&A), every deal has two sides: the sell-side and the buy-side. The sell-side team represents the seller and supports them in preparing the business for sale, reaching out to potential buyers, and negotiating the best possible price and terms. On the other side, the buy-side team works with the acquirer to identify attractive targets, evaluate them, and execute the purchase.Investment banks and advisory firms often act on either side of a transaction. Most firms work on both buy-side and sell-side assignments across different deals, but never on both sides of the same transaction as that would create a conflict of interest. This guide will focus on the sell-side M&A process and provide sample interview questions to help you prepare for investment banking interviews.