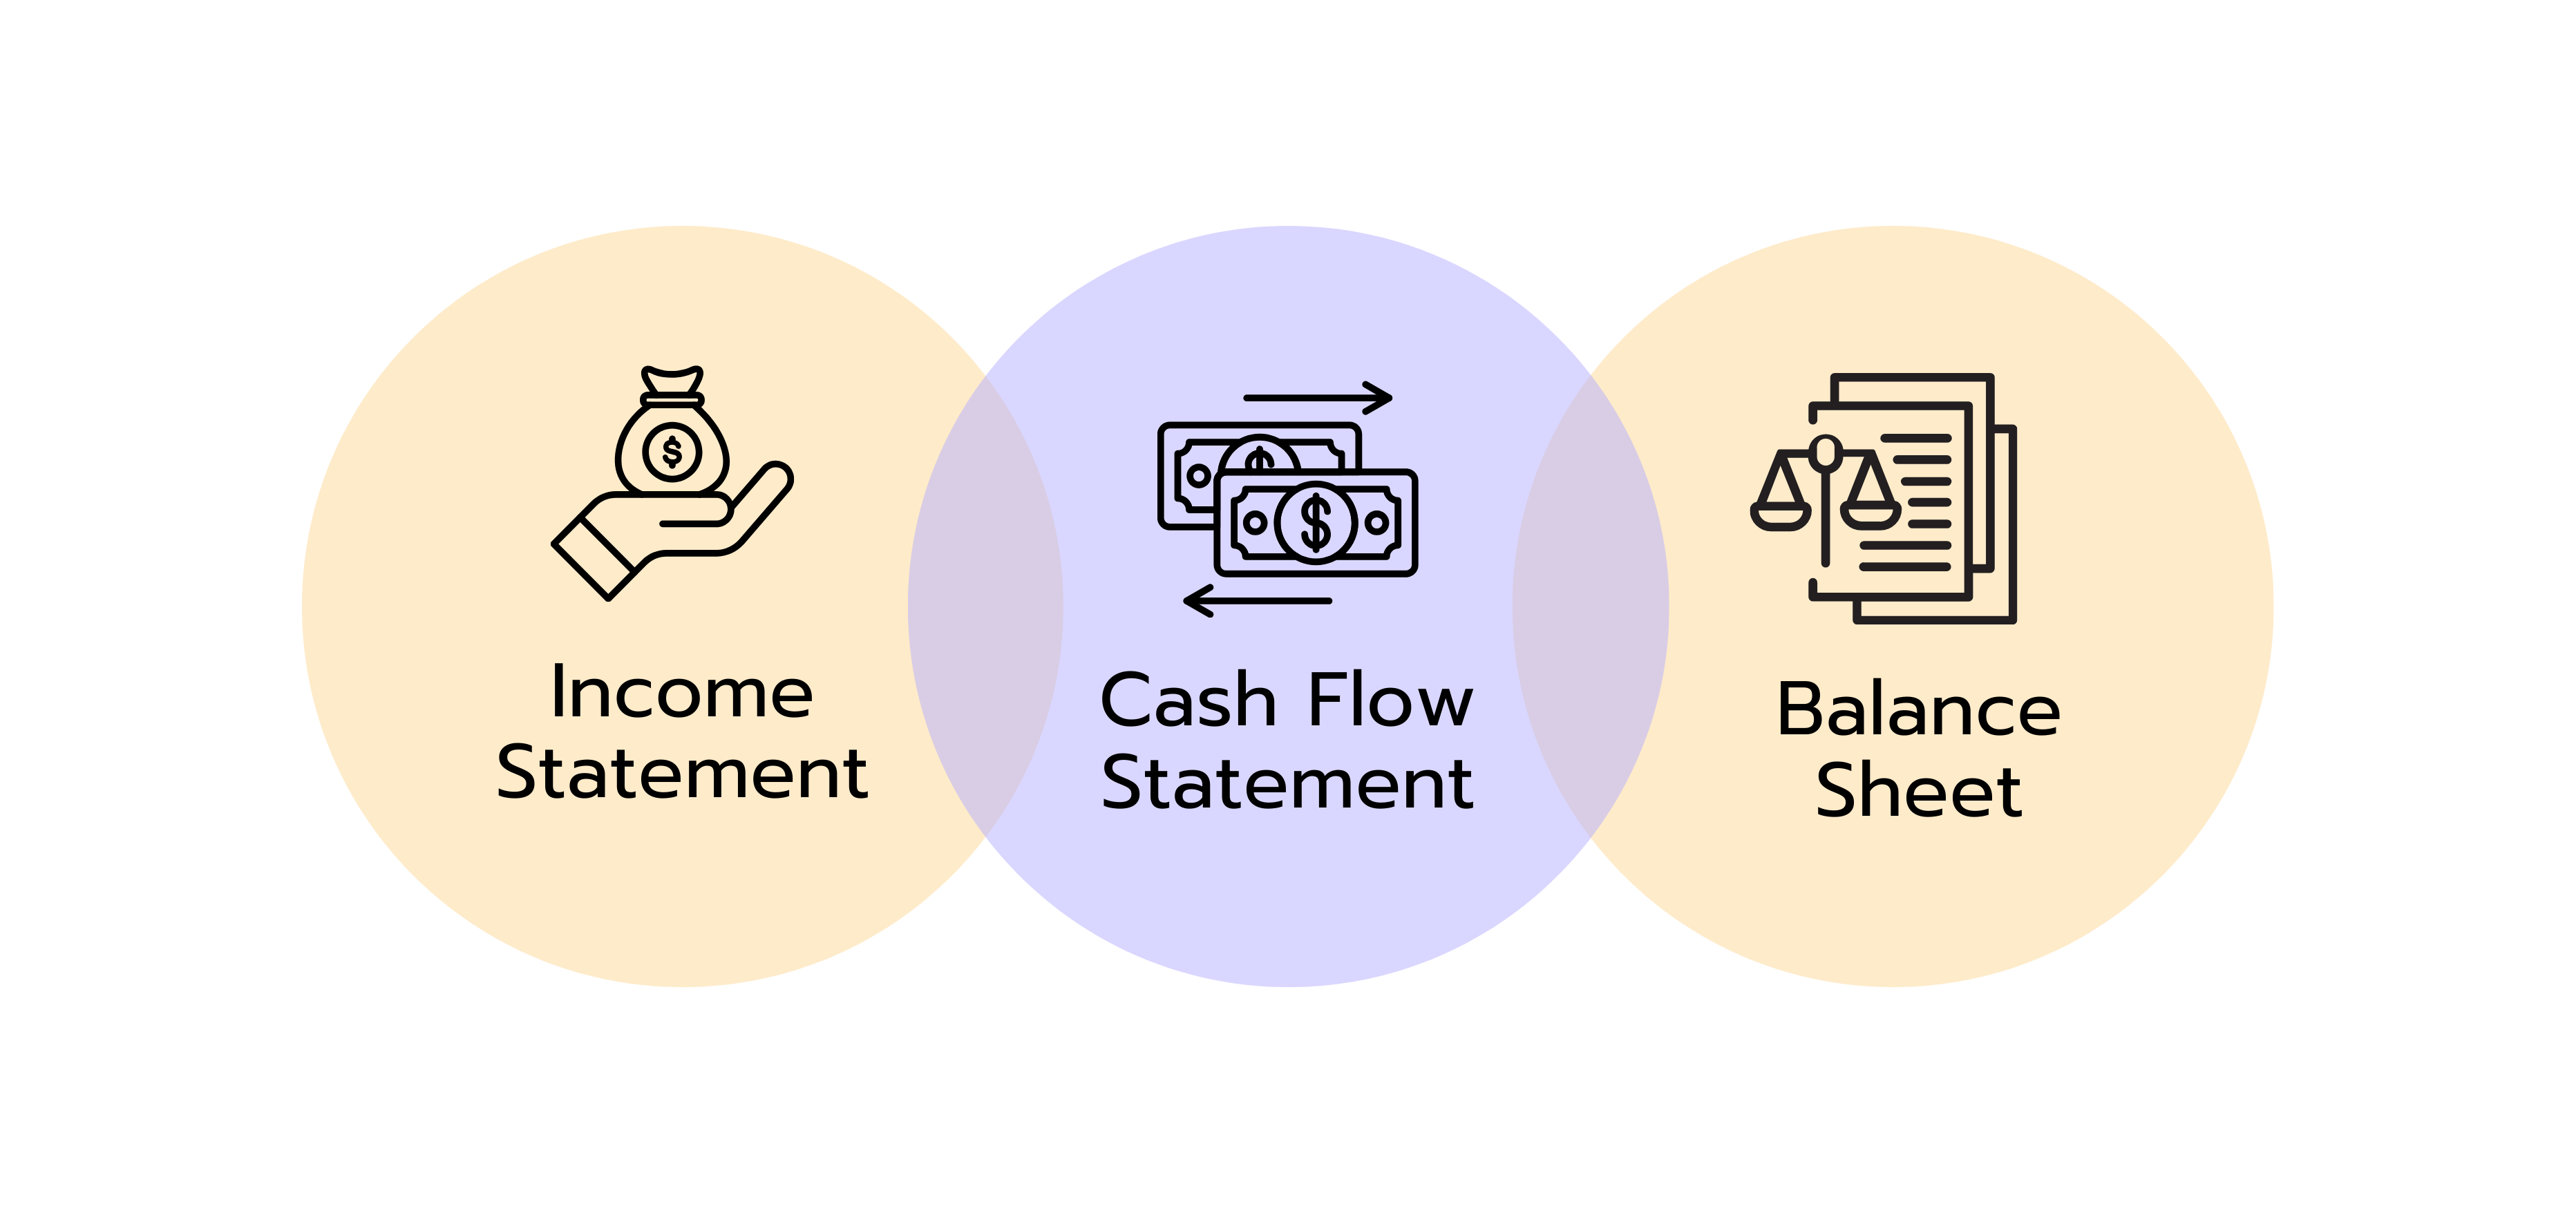
The cash flow statement is one of the three most important financial reports used by companies, alongside the balance sheet and the income statement. It shows how actual cash flows develop within a business, so when and how much money flows in or out of the company. This provides direct insight into a company’s liquidity and its ability to meet financial obligations.
Unlike the cash flow statement, the balance sheet and income statement are based on the accrual accounting principle. Under this approach, revenues and expenses are not recorded when cash changes hands but are instead assigned to the accounting period in which they are economically incurred.
In contrast, the cash flow statement is based on actual cash movements, therefore serving as a powerful tool in financial analysis. By focusing on real cash flows, it enables analysts to cut through the complexity of accounting and assess whether a company is truly generating cash or rather burning it.
The cash flow statement is a financial report that tracks how much cash a company received and spent during a specific period, typically a quarter or year. It answers the question: where did the money come from, and where did it go?
So, it’s all about cash flows which are either inflows or outflows. Cash inflows refer to the money coming into the business from sources like customer payments, loan proceeds, or asset sales. Cash outflows show money leaving the company for expenses, loan repayments, equipment purchases, or dividend payments.
What Are the Most Important Elements of the Cash Flow Statement?
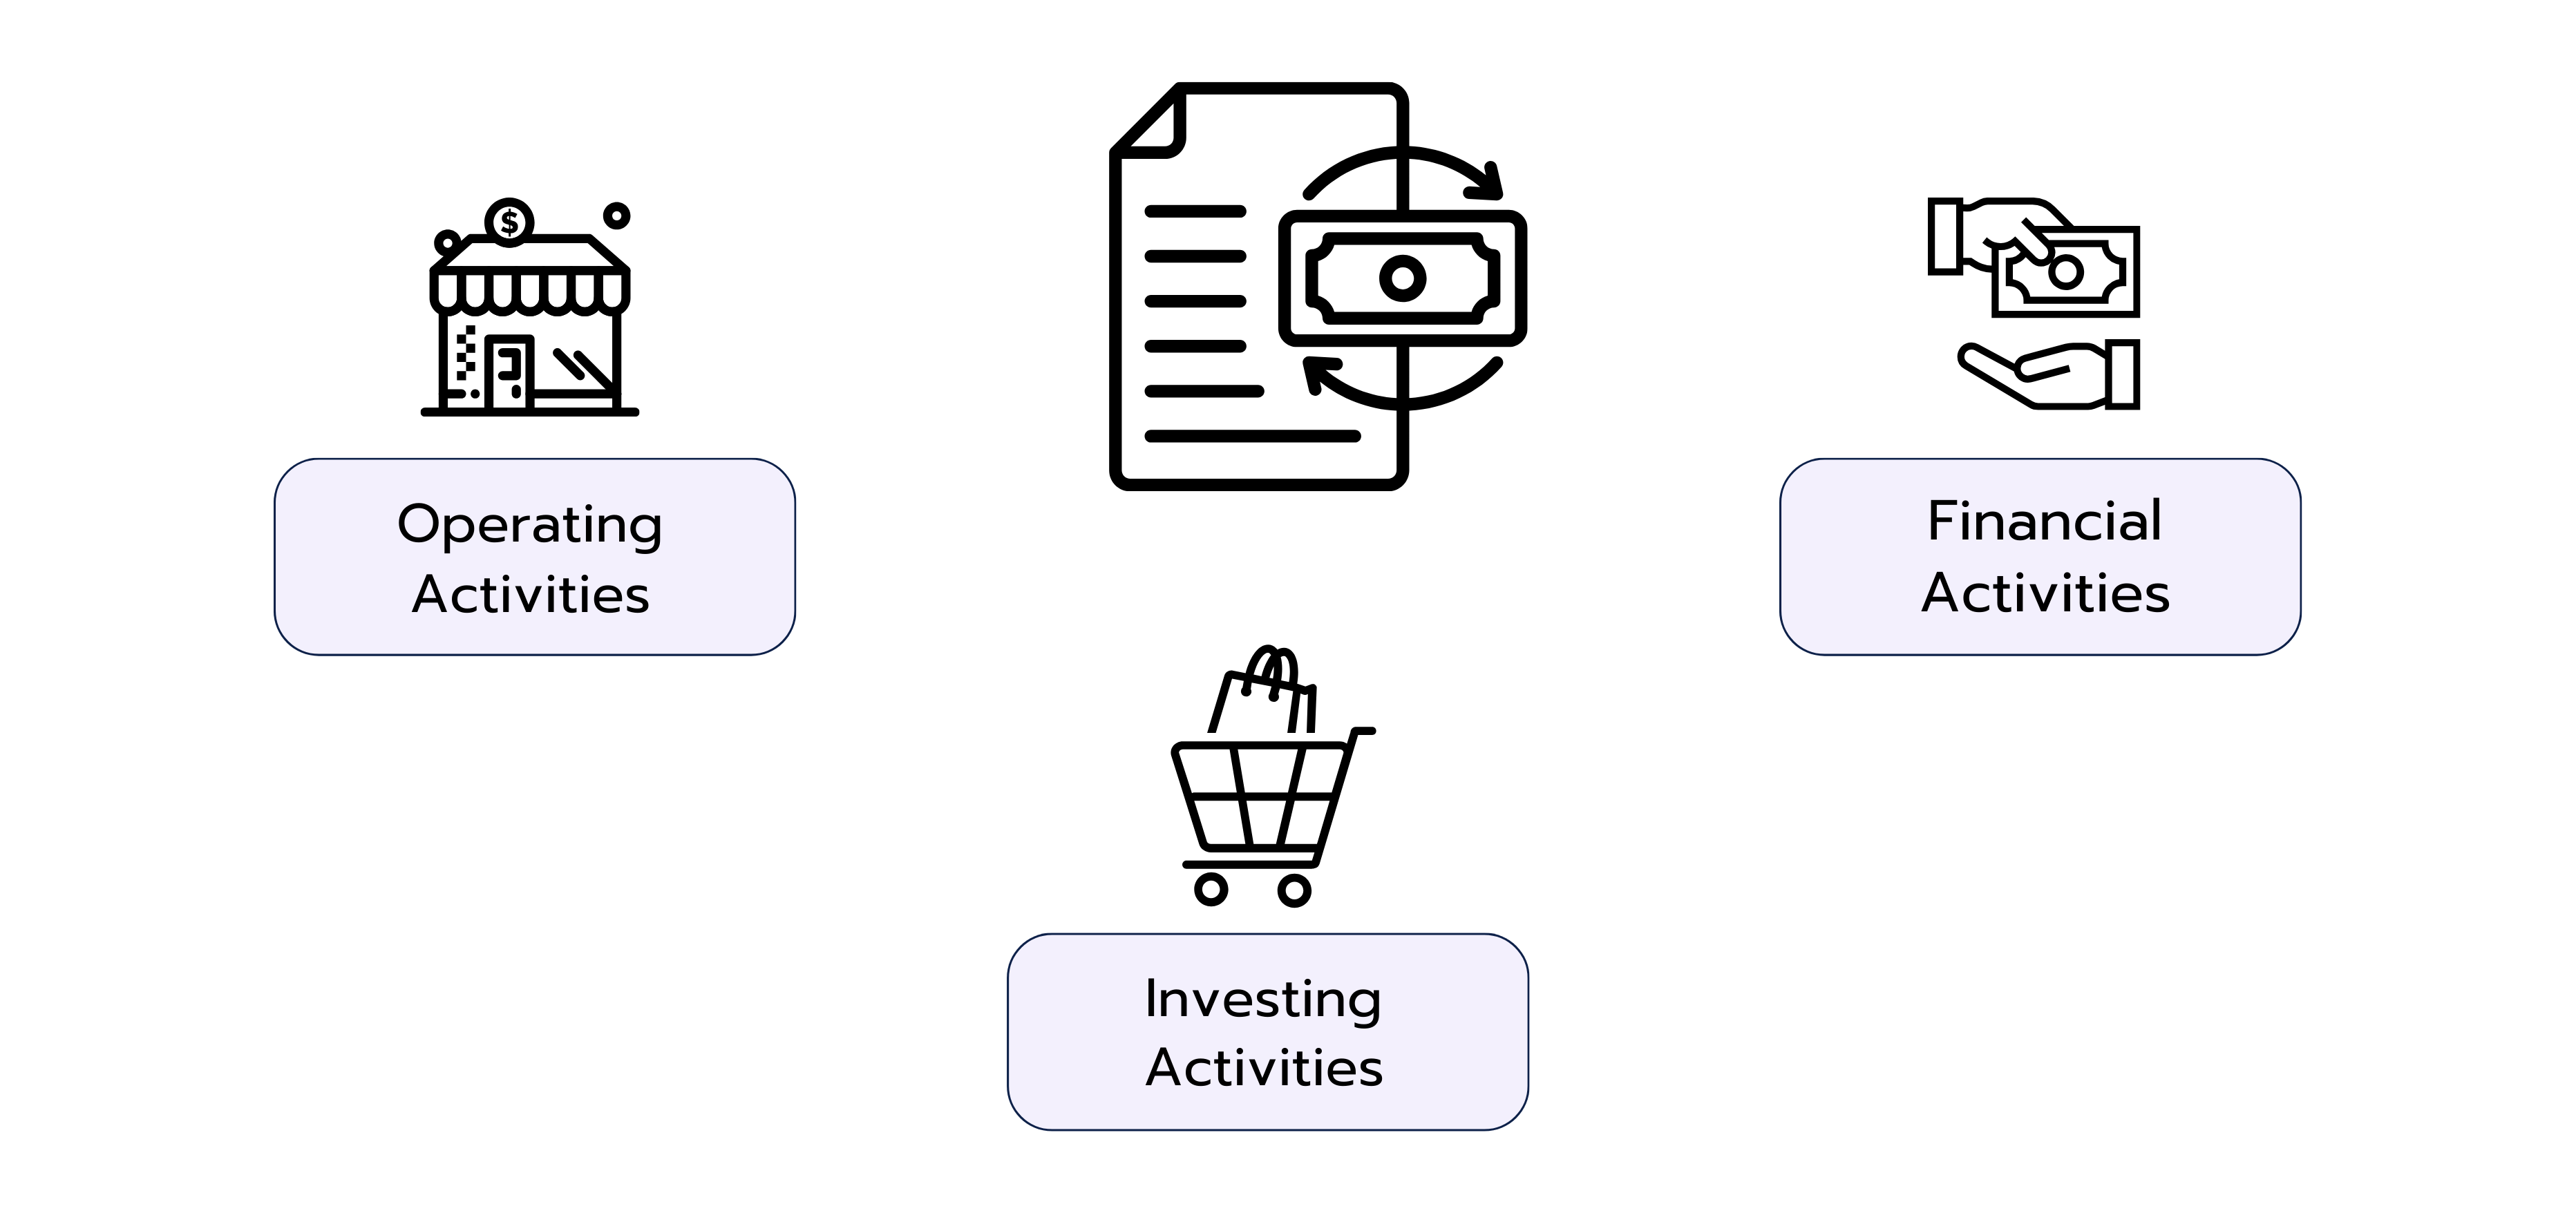
The cash flow statement organizes the inflows and outflows into three main categories. These are operating activities, investing activities, and financial activities.
Operating Activities
The operating cash flow section shows how much cash is being generated or used in running the business’s core operations or day-to-day activities. As such, this part tells us whether a business can generate positive cash flow from its primary operations, which is crucial for long-term sustainability.
The cash inflows for operating activities include all money received from customers for the sale of goods and services. It also includes other income related to the core business such as royalties, fees, commissions, and cash refunds from suppliers. Cash outflows for the operating activities section include money paid to suppliers for inventory and services, salaries and wages, operating expenses like rent and utilities, interest on business loans, and income tax payments.
Companies can present operating cash flows using either the direct or indirect method. The direct method lists the major categories of operating cash receipts and payments during the period. For example, it shows cash collected from customers, cash paid to suppliers, and cash paid for operating expenses as separate line items. It requires detailed information so it’s rarely used in practice.
The indirect method starts with the net income reported on the income statement and adjusts it to arrive at the actual operating cash flow. The following factors are taken into account:
Adding Back Non-Cash Expenses
All expenses that did not involve an actual outflow of cash are added back to net income. These include, for example, depreciation, stock-based compensation, bad debt expenses, or impairment losses.
Substracting Non-cash revenues
Conversely, revenues that did not result in actual cash inflows are subtracted. This mainly applies to gains from the sale of assets, as these are reported under investing or financing activities.
Changes in working capital
Working capital changes occur when there's a timing difference between when revenue/expenses are recorded and when cash is actually received/paid.
Receivables: When receivables increase, the company has delivered goods or services but has not yet received payment – the amount is subtracted from net income. When receivables decrease, it means customers have paid outstanding invoices – the corresponding amount is added to net income, as actual cash has now been received.
Payables: When payables increase, the company has incurred expenses but has not yet paid them. Although the expense has already been recorded in the income statement, no cash has left the business. These unpaid invoices temporarily increase cash flow and are therefore added back to net income. If payables decrease, it means existing debts have been settled, so cash has flowed out of the business. This cash outflow is subtracted from net income during the calculation.
The result of the indirect method is an adjusted operating cash flow, which shows how much cash the core business has actually generated – regardless of any accounting distortions.
Investing Activities
The investing cash flow section shows the money spent on and received from investments in long-term assets and securities. From these activities, you can tell how a company is investing in its future growth or selling off assets for cash.
Cash inflows from investing activities include cash received from sale of property, plant, and equipment (PPE) and investments like stocks, bonds, or other investment securities. Other common sources of inflow here are receipt of principal from loans made to others, insurance proceeds from damaged assets, and cash from sale of subsidiaries or business units.
The common sources of cash outflows for investing activities include cash spent on acquiring new machinery, buildings, or equipment, purchase of investments like stocks, bonds, or other securities, and loans made to others.
Financial Activities
Financing activities detail the cash flows related to raising or repaying capital, whether it’s through debt or equity. They show how a business funds its operations and growth outside of its regular course of business.
The common cash inflows for financing activities are issuance of stock and borrowing either through loans or issuing bonds. Outflow sources include repayment of debt, dividends paid, and repurchase of stock.
How to Read and Interpret the Cash Flow Statement
Analyzing and interpreting a cash flow statement effectively requires the ability to understand what the numbers on the report tell you about a company’s financial health and strategic direction.
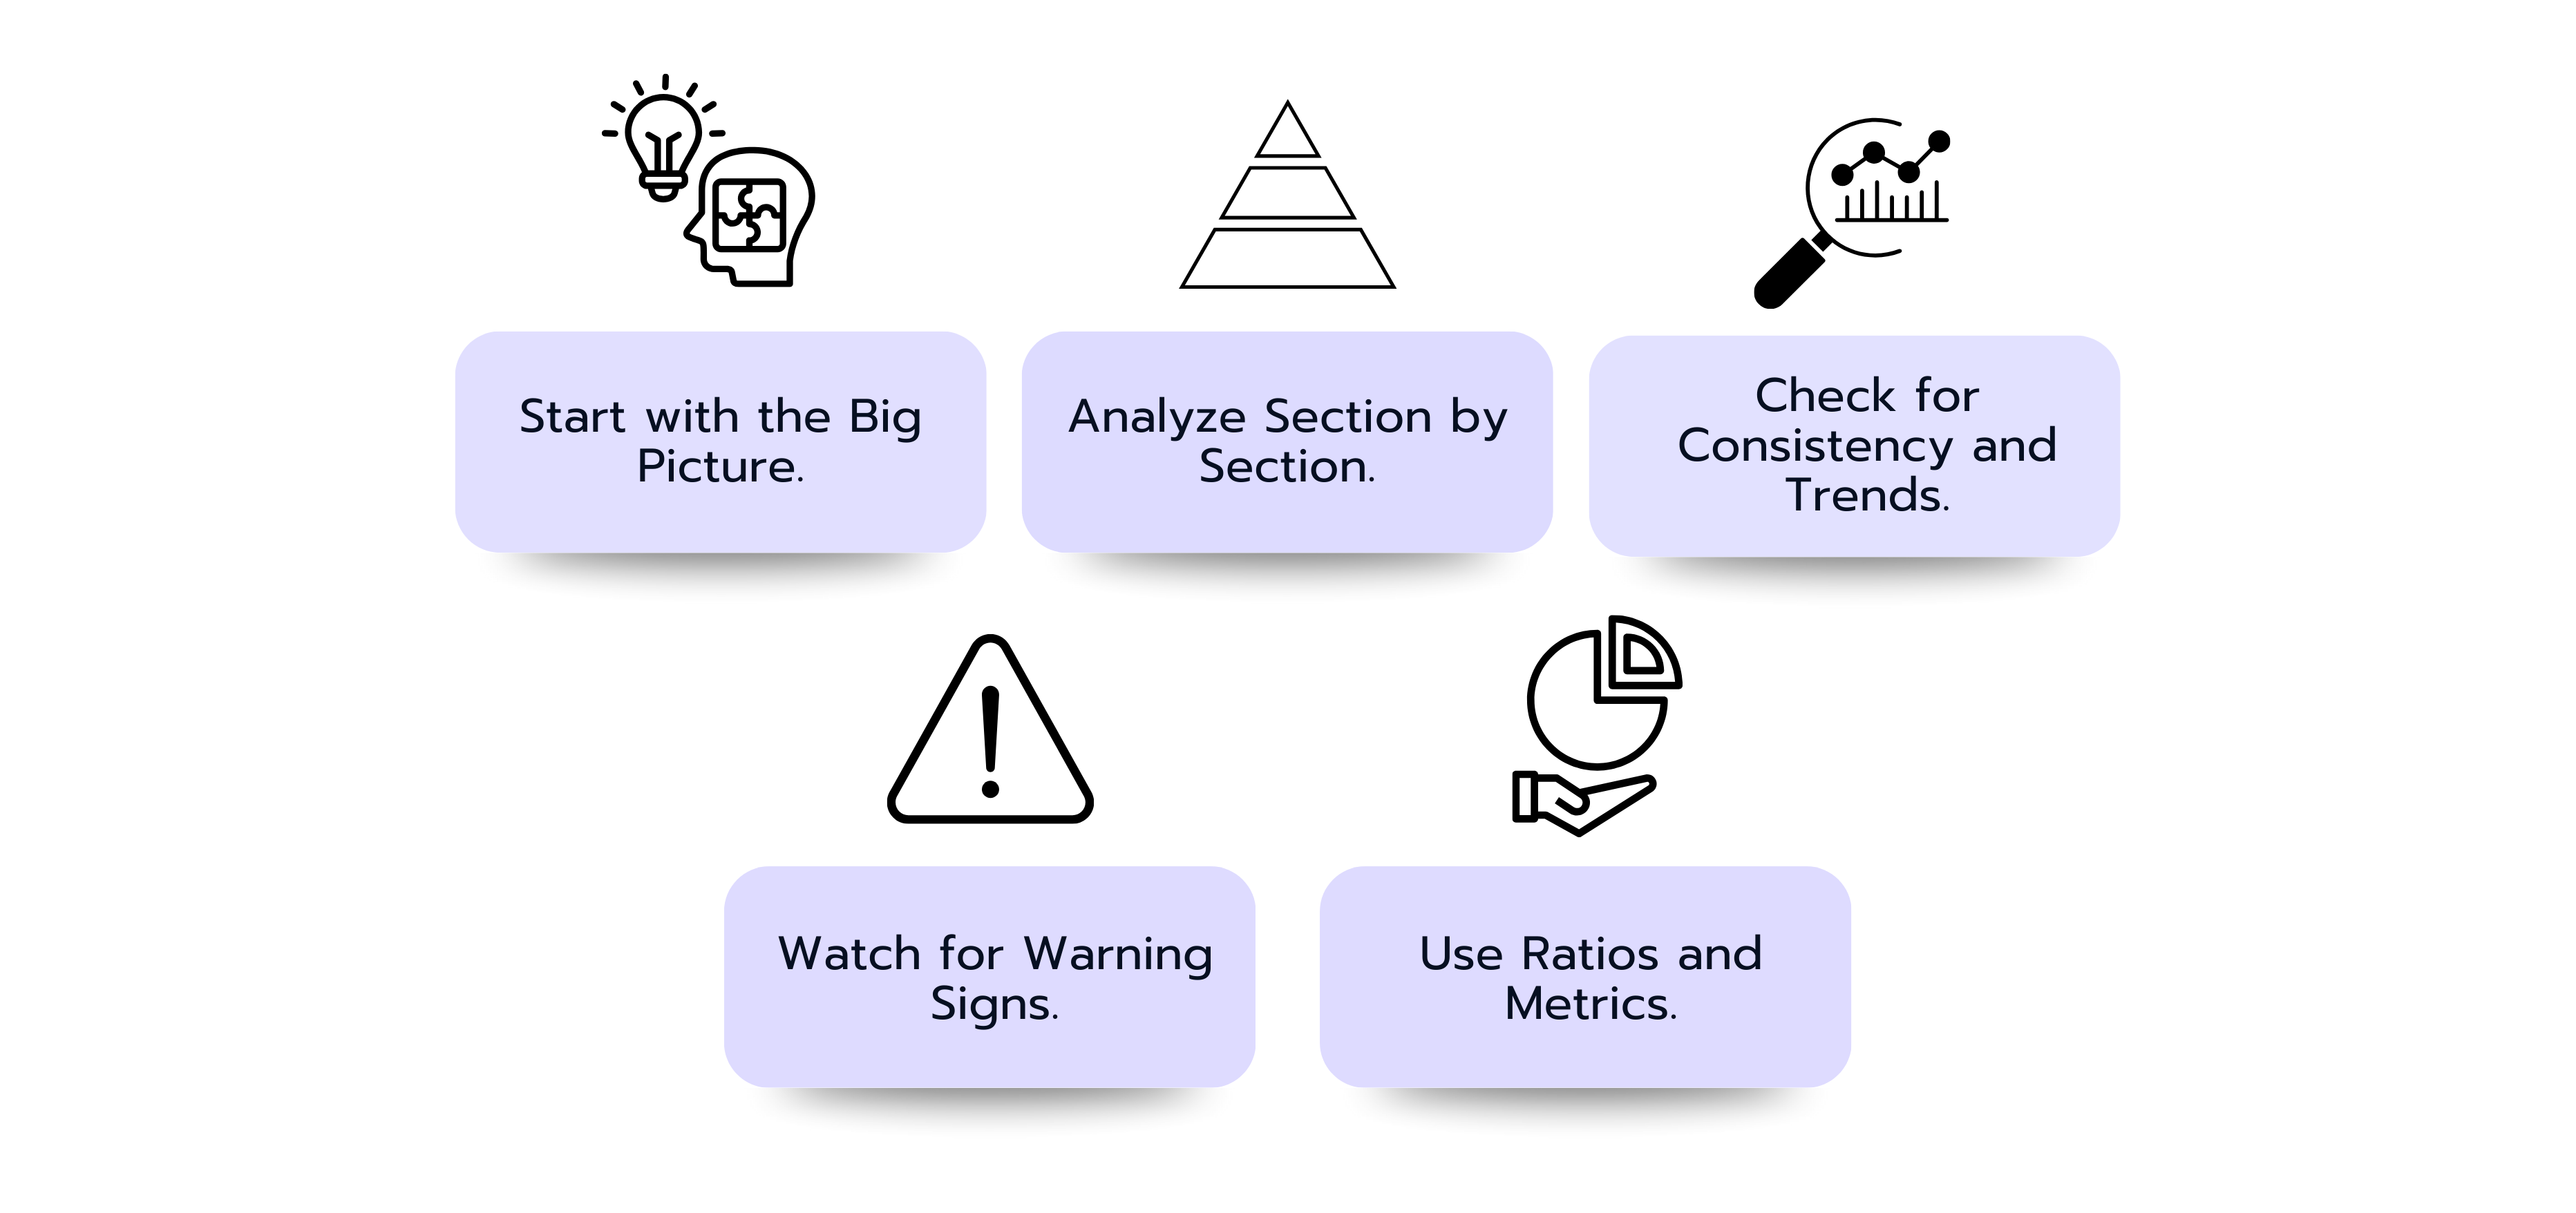
Start with the Big Picture.
Start by looking at the net change in cash at the bottom of the statement. A positive number means the company has more cash at the end of the period while a negative number means it has less. However, this alone doesn't tell the whole story. A company might have increased its cash position by taking on massive debt, which could be problematic long-term.
Analyze Section by Section.
Proceed to break it down by section. For the operating activities, look at whether the cash flow is increasing, declining, or highly volatile. The ideal scenario is a positive and growing cash flow as it shows the company’s core business is generating cash. If there’s consistently negative cash flow from operations, it can signal trouble suggesting the business isn’t bringing in enough cash to sustain itself.
You can also compare net income to operating cash flow. If operating cash flow is consistently much lower than net income, investigate why. Large increases in accounts receivable might indicate collection problems, while inventory build ups could suggest demand issues.
For the investing section, pay attention to the outflows. They’re common here as companies invest in equipment, property, or acquisitions. Modest, regular outflows can mean healthy reinvestment. Red flags include large, repeated inflows from asset sales which may mean the company is selling off assets to cover short-term needs. That isn’t sustainable long-term.
Then move to the financing cash flow section and look at the line items. Inflows mean the company is raising money, through loans or issuing shares, while outflows mean it’s paying off debt, buying back shares, or paying dividends. New companies often show inflows here, while mature companies usually have outflows as they return value to shareholders and pay down debt.
Check for Consistency and Trends.
Look at cash flows for several periods to spot patterns. Is operating cash flow consistently positive? Are investing outflows matched by growth in assets or revenue? You can also compare to peers. See how cash flow metrics stack up against similar companies in the same industry.
Watch for Warning Signs.
As you go through the cash flow, analyze whether there are red flags or warning signs such as:
Positive net income but negative operating cash flow: This discrepancy can suggest aggressive revenue recognition, where sales are booked before the cash is actually collected, or poor collection of receivables, meaning customers are slow to pay. It might also reflect rising inventory levels, which tie up cash even if sales appear strong. Over time, this can lead to liquidity problems despite seemingly healthy profits.
Negative cash flow in all sections (operating, investing, and financing): If all three sections show outflows, the company may be burning cash with no immediate inflow sources. This often points to a serious cash crunch and could mean the business will need to raise debt or equity soon just to keep operating. In extreme cases, it might be a sign of distress or even impending insolvency.
Use Ratios and Metrics.
There are a few ratios and metrics you can calculate from the cash flow statement to interpret the financial position of a company including:
Free Cash Flow (FCF)
Formula: Operating Cash Flow − Capital Expenditures (from investing activities)
What it shows: This measures the cash left after funding necessary investments in the business (like equipment, technology, or facilities). Positive and growing FCF gives the company flexibility to pay down debt, pay dividends, repurchase shares, or pursue acquisitions. Consistently negative FCF can be acceptable for high-growth companies investing heavily, but it’s a concern if it persists without revenue growth.
Cash Flow to Debt Ratio
Formula: Operating Cash Flow ÷ Total Debt
What it shows: This indicates how many years of current operating cash flow it would take to repay all debt. Higher ratios suggest stronger debt-paying ability, while low or declining ratios can signal over-leverage and potential solvency issues. Lenders often monitor this ratio when assessing credit risk.
Cash Flow to Current Liabilities Ratio
Formula: Operating Cash Flow ÷ Current Liabilities
What it shows: This measures the ability to cover short-term obligations with cash generated from operations. A ratio below 1.0 can mean the company might struggle to meet near-term obligations without additional financing or asset sales.
Operating Cash Flow to Net Income Ratio
Formula: Operating Cash Flow ÷ Net Income
What it shows: This ratio highlights the quality of earnings. Ideally, it should be close to or above 1.0 over time, meaning reported profits are supported by real cash inflows. A consistently lower ratio can indicate earnings manipulation, aggressive accounting, or working capital problems.
Common Interview Questions About the Cash Flow Statement
Most interview questions about the cash flow statement focus on your understanding of its structure, components, and how various financial activities impact it. Here are common questions to help with your practice:
1. Walk me through the cash flow statement.
The cash flow statement is a financial statement used to report the actual movement of money into and out of a business. It is divided into three main sections. Operating activities show cash from day-to-day business operations like sales and expenses. Investing activities capture cash spent on or received from long-term assets like equipment purchases or asset sales while financing activities reveal cash movements from debt, equity, and dividend transactions.
Together, these three sections tell the complete story of how a company's cash position changed, providing crucial insights that profit figures alone cannot deliver.
2. What is the difference between net income and cash flow?
Net income is calculated using accrual accounting and includes non-cash items like depreciation and accounts payable/receivable changes. Cash flow shows the actual inflows and outflows of cash during a period. So, while net income can be positive, the company might have negative cash flow if, for instance, significant sales are on credit or there are large capital expenditures.
3. How does a non-cash expense (e.g., depreciation) affect the cash flow statement?
Depreciation is the gradual allocation of an asset’s cost over its useful life. For example, spreading the cost of machinery over several years instead of recording it all at once. It reduces net income because it is recorded as an expense, but no cash actually leaves the company. On the cash flow statement, depreciation appears under operating activities and is added back to net income so the statement reflects the actual cash generated from operations.
4. Explain how transactions like equipment purchase or sale impact the cash flow statement.
Purchasing equipment is recorded as a cash outflow under investing activities, since the company is spending cash to acquire a long-term asset. On the other hand, selling equipment results in a cash inflow in investing activities. Though any gain or loss from the sale affects net income, the actual cash received from the sale is shown separately in the cash flow statement.
5. How are increases in accounts receivable or inventory shown in the cash flow statement?
When accounts receivable increase, it means the company has made sales but has not yet collected the cash. When inventory increases, the company has spent cash to buy or produce goods that have not yet been sold. In both cases, cash is tied up and unavailable for other uses. On the cash flow statement, these increases appear in the operating activities section and are subtracted from net income to show the reduction in actual cash.
6. Can a company survive with negative cash flow from operations if investing and financing sections are positive?
A company can temporarily survive negative operating cash flow if it’s able to bring in cash from investing, like selling assets, or financing, like taking on debt or issuing shares. However, this isn’t sustainable long-term. Consistently negative operating cash flow usually points to underlying problems with the core business, and relying on outside funds can only last so long before issues arise.
7. How can a company have profits but still face a cash shortage?
This happens due to accrual accounting. Profits (net income) are recorded when revenues are earned, not when cash is collected. If sales are made on credit or if expenses are deferred, a company can show profits on paper but not actually have enough cash coming in to cover daily expenses, leading to a cash shortage.
8. Why is free cash flow important, and how is it calculated?
Free cash flow is important because it shows how much cash a company has left after covering capital expenditures needed to maintain or grow its assets. It represents the cash available for dividends, debt repayment, or reinvestment. It’s calculated as operating cash flow minus capital expenditures, usually found under investing activities.
9. How would you assess the cash position of a company using the cash flow statement?
Start by examining the net change in cash to determine whether the company’s cash balance is increasing or decreasing. Then assess whether operating activities are consistently generating positive cash flow, which typically indicates a healthy core business. Finally, review the investing and financing sections to understand how the company is funding its operations and whether it is investing for growth or relying on external financing.
10. If a company has positive net income but negative cash flow from operations, what might that indicate?
This often indicates issues like aggressive revenue recognition, poor cash collections, or rising receivables and inventory. It means the company is recording profits but isn’t actually collecting enough cash from its customers, which can be a warning sign about the quality of earnings or cash management.
👉 In our case library, you’ll find plenty of practice cases and exercises focused on the cash flow statement – perfect for your finance interview prep!
Case Library
Discover more than 200 practice cases for every level and case type.
How Does the Cash Flow Statement Connect with the Income Statement and Balance Sheet?
The net income from the income statement is the starting point for the operating activities section of the cash flow statement. Since net income is calculated on an accrual basis, it is adjusted for non-cash items (such as depreciation) and changes in working capital accounts (like receivables, payables, and inventory) to arrive at cash from operations.
The ending cash balance from the cash flow statement then updates the cash line on the balance sheet. At the same time, net income flows into retained earnings within shareholders’ equity on the balance sheet. These links connect all three statements.
In this way, the cash flow statement acts as a bridge between the income statement and the balance sheet. It reconciles accrual-based profits with actual cash movements and explains how changes in balance sheet accounts affect the company’s cash position from one period to the next.
Key Takeaways
The cash flow statement provides a clear view of how cash is generated and used in operations, investing, and financing activities. This is important because profitability or net income alone doesn’t reveal the company’s liquidity or ability to meet obligations.
The cash flow statement bridges accrual accounting and actual cash reality, showing whether a company can fund operations, invest in growth, and meet obligations from the cash it actually generates. Some of the warning signs to look for include a positive net income but negative operating cash flow, heavy reliance on asset sales or external financing to fund operations, and large gaps between net income and operating cash flow.
Let's Move On With the Next Articles:
Sell-Side M&A
Processes in Finance
In finance, Mergers & Acquisitions (M&A) refers to the process of mergers and corporate takeovers, where companies are combined or acquired to achieve strategic growth, greater efficiency, or competitive advantages.In mergers and acquisitions (M&A), every deal has two sides: the sell-side and the buy-side. The sell-side team represents the seller and supports them in preparing the business for sale, reaching out to potential buyers, and negotiating the best possible price and terms. On the other side, the buy-side team works with the acquirer to identify attractive targets, evaluate them, and execute the purchase.Investment banks and advisory firms often act on either side of a transaction. Most firms work on both buy-side and sell-side assignments across different deals, but never on both sides of the same transaction as that would create a conflict of interest. This guide will focus on the sell-side M&A process and provide sample interview questions to help you prepare for investment banking interviews.
In finance, Mergers & Acquisitions (M&A) refers to the process where companies are combined or acquired to achieve strategic growth, efficiency, or market advantages.Mergers and acquisitions (M&A) transactions have a buy-side and a sell-side. The sell-side team represents the seller and works to market the business to potential buyers, while the buy-side team represents the acquirer. For the buyers or acquirers, the focus is on acquiring the right target with minimal risk and maximum strategic or financial upside. So it requires a lot of due diligence, valuation analysis, and strategic assessment.Read on to understand the entire buy-side M&A process and get some practice questions to prepare for finance interviews.
A Leveraged Buyout (LBO) is a type of acquisition where a buyer chooses to finance the purchase using borrowed money or debt and some cash investment, known as equity. So, the "leverage" in leveraged buyout refers to this heavy use of debt financing. In most LBOs, 60-90% of the purchase price comes from borrowed money, while only 10-40% comes from the buyer's own cash.The buyer uses the future cash flows and assets of the company being acquired as collateral for the loans. They can also use the assets of the acquiring company if necessary. Over time, the debt is paid back using the cash that the target company generates. The buyers aim to exit profitably through a sale, merger, or public offering after improving the company's performance and paying down the debt.