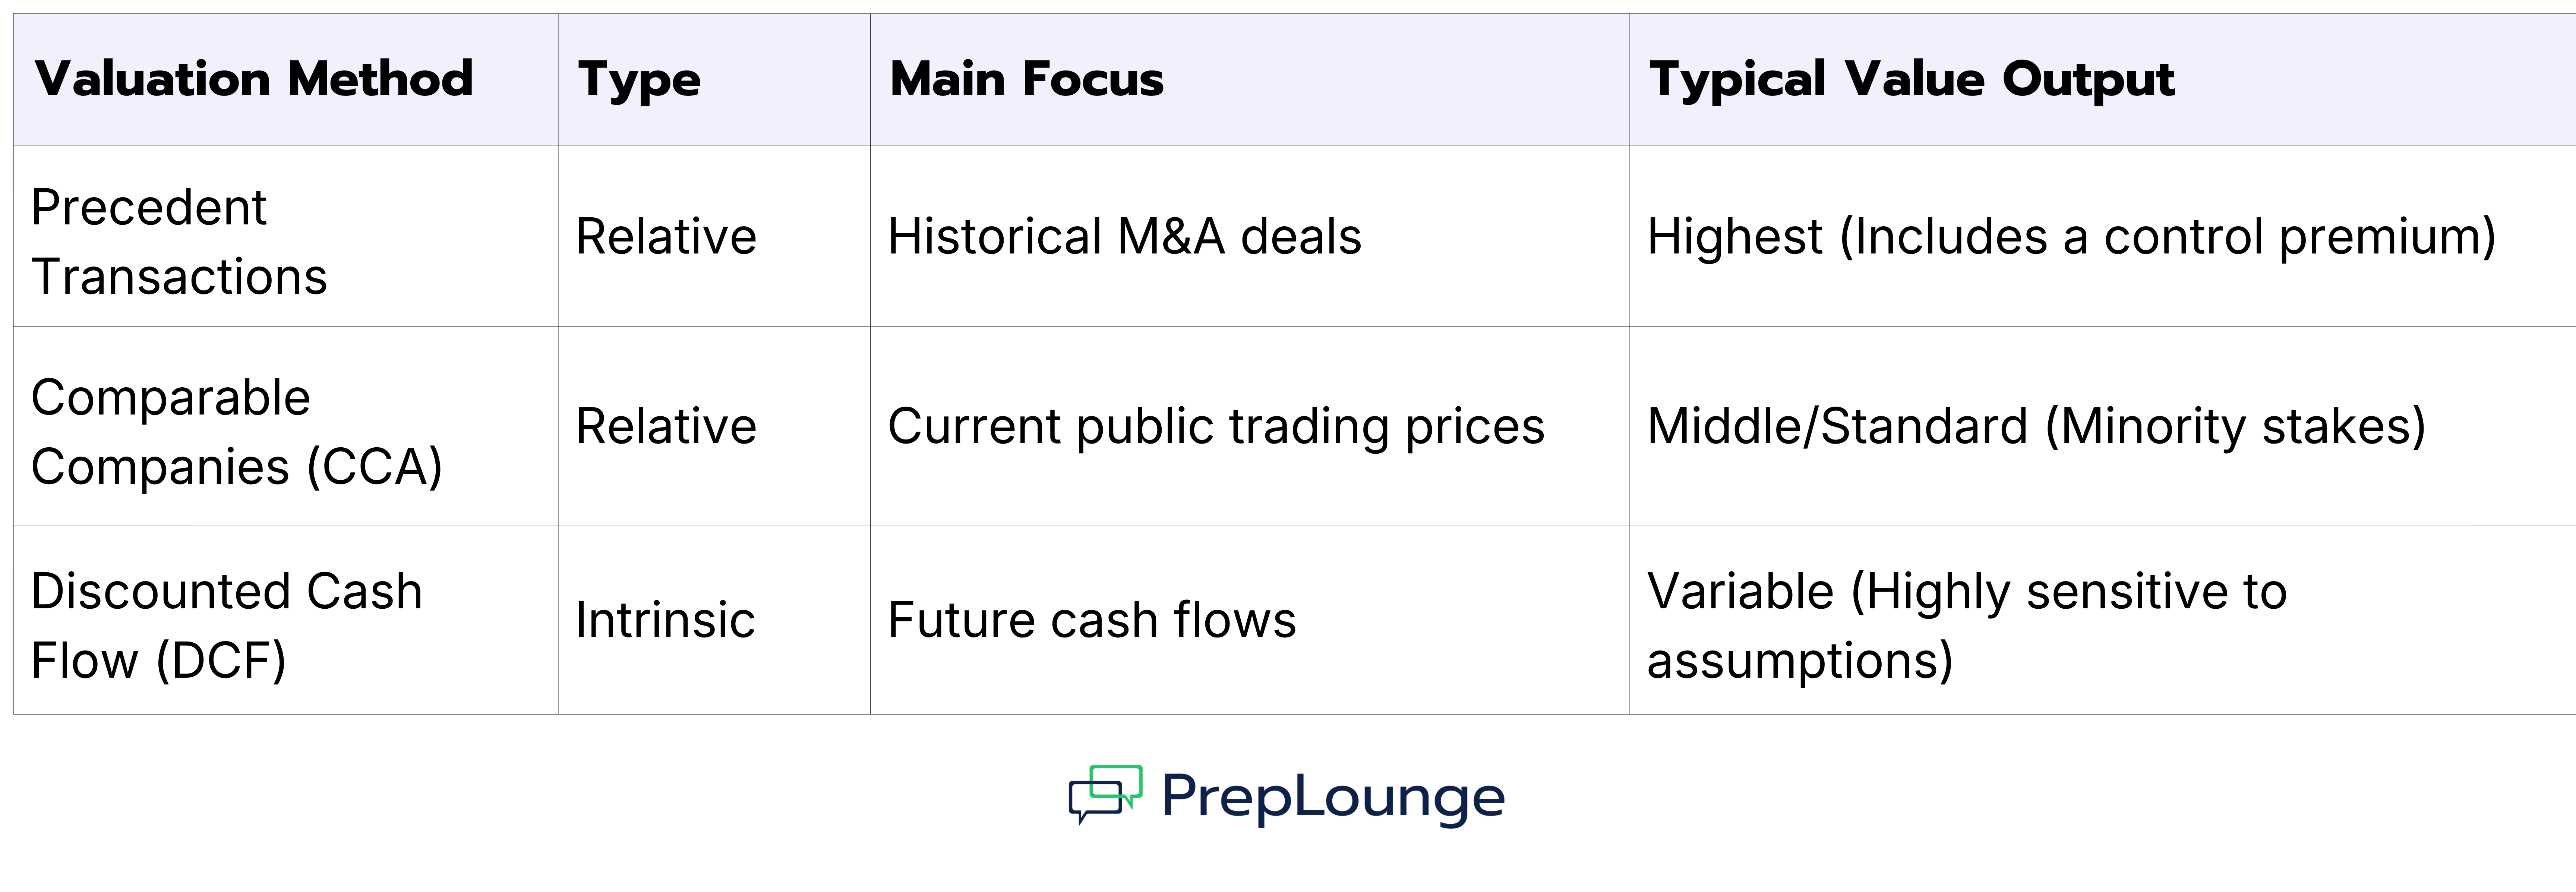
When a company wants to buy another business, they always ask, “How much is it worth?” To find the answer, investment bankers mostly use three popular valuation methods: Comparable Company Analysis, Discounted Cash Flow, and Precedent Transactions Analysis.
Each one answers that same question but gets there in a different way. For this guide, we will focus on Precedent Transactions Analysis (PTA) which looks at what past buyers actually paid for similar companies to determine the worth of the target.
Read on to understand how PTA works, why it’s important in M&A, how it compares to DCF and Comparable Company Analysis, and what questions interviewers tend to ask about it.
Precedent Transactions Analysis (PTA) is a relative valuation method that estimates a company's worth by looking at what buyers actually paid for similar companies in the past. Instead of guessing or estimating what a fair price should be, you look at recent deals and use those prices as a reference point.
This is why PTA is also called transaction comps, transaction comparables, M&A comps, comparable transactions, acquisition comparables, comparable transactions analysis, or deal comps. It’s built entirely from M&A activity, not from how public stocks are trading.
Why Is Precedent Transactions Analysis Important in M&A?
PTA is crucial in M&A because a completed transaction tells you what a real buyer, under real conditions, decided to hand over money for. So, this method establishes a baseline for what a rational buyer will actually pay.
That makes PTA especially useful in a few situations, both in precedent transaction analysis investment banking work and in private equity work:
M&A Deal Pricing: When advising a client on selling a company, bankers use PTA to set realistic price expectations based on what similar deals have closed for.
Fairness Opinions: Boards need an independent check that a deal price is reasonable and financially fair to shareholders. PTA provides a market-based benchmark for that.
Negotiation Leverage: If a buyer is lowballing, the seller's banker can point to precedent deals that closed at higher multiples to push back.
It’s also worth noting that the buyer type behind each precedent deal matters too. Analysis of a strategic buyer vs. financial sponsor shows that strategic ones may pay more for synergies. But a financial sponsor is typically more price-disciplined since it's buying based on a future exit, not a permanent fit into existing operations.
Precedent Transactions Analysis vs Comparable Company Analysis vs Discounted Cash Flow
Now that you have a good idea of what PTA is, it’s important to understand how it stacks up against the other two core valuation methods. All three reveal the worth of a company but they pull from different sources and tend to land on different numbers.
PTA vs CCA
Both Comparable Company Analysis (CCA) and Precedent Transactions are core relative valuation methods used in investment banking to benchmark the value of a target company against market data. But CCA, also called comparable companies analysis or trading comps, uses current stock market multiples of similar public companies whereas Precedent Transactions use the acquisition multiples paid in historical M&A deals.
CCA values tend to come in lower than PTA values for the same company because PTA includes control premiums. In M&A deals, buyers pay a premium, often 20%–40%, to gain control of a company, and they also factor in the value of anticipated synergies. But CCA only reflects a single share or minority, standalone public trading values.
PTA vs DCF
Unlike CCA and PTA which are relative valuation methods, Discounted Cash Flow (DCF) is an intrinsic approach. It ignores the market entirely and instead estimates value by projecting a company's future cash flows and discounting them back to today using a required rate of return. So, DCF is built from the company's own numbers and assumptions rather than outside market data.
Bankers rarely use just one valuation method. They build all three side by side and present them together, usually as a football field chart. A football field chart is a horizontal bar graph that allows clients to see at a glance where the valuation ranges of PTA, public trading comps, and DCF analyses overlap, helping them pinpoint a target's ultimate value.
How Does Precedent Transactions Analysis Work?
Analysts use a 4-stage process to perform precedent transaction analysis. These steps include finding the right deals, pulling the data from those deals, turning that data into multiples, and applying those multiples to the company you're valuing.
Below is an overview of each of these four precedent transaction analysis steps.
Step 1: Select Comparable Transactions
The first step is finding past deals that are genuinely similar to the situation you're analyzing. You must set up specific screening criteria to filter down thousands of global deals into a tight list of relevant peers. What you end up is usually known as a peer universe or comparable universe. The screening criteria usually includes factors such as:
Industry: A software acquisition isn't comparable to a manufacturing acquisition. Stick to the same sector, and ideally the same sub-sector.
Deal Size: A $50 million deal and a $5 billion deal behave very differently. Try to match deal size as closely as possible.
Geography: Regulatory environments, growth expectations, and buyer pools vary by region, so deals from the same general market are more reliable.
Timing: Older deals reflect outdated market conditions, financing environments, and pricing expectations. Most analysts cap the lookback window at two to three years, sometimes longer for niche industries with few deals.
The more criteria you apply, the fewer deals you'll find, but the ones you do find will be more comparable. Cast the net too wide, and you'll include deals that aren't truly similar. Cast it too narrow, and you might end up with only one or two data points, which isn't enough to draw a reliable conclusion. Good analysts find the balance, usually between 6 and 15 transactions.
Step 2: Gather Transaction Data
For every deal on your list, you’ll need the price paid and the target's financials at the time of the deal. The price comes from the deal announcement, usually the enterprise value or equity value the buyer paid while the financials come from the target's most recent reporting before the deal closed, things like revenue, EBITDA, or net income.
Getting these details requires digging directly into verified public filings and SEC filings, specifically looking for documents like the Form 8-K (current report of a material event), the Merger Proxy (sent to shareholders for deal approval), or a Schedule 14D-9 (the target's recommendation statement regarding a tender offer).
Other sources include industry reports and databases like SDC Platinum, CapIQ (Capital IQ), Bloomberg, or PitchBook that compile deal data and news coverage when official filings aren't available. This is exactly where precedent transaction analysis for private company valuation gets harder. Your dataset is only as good as what's actually been disclosed, and for private targets, that's often very little.
Step 3: Calculate Transaction Multiples
Once you have clean price and financial data for each deal, begin spreading multiples, or spreading comps, which is investment banking shorthand for inputting the raw financial numbers into an Excel valuation template to generate standardized ratios.
The most common ratios or multiples are EV/Revenue or EV/Sales and EV/EBITDA, though EV/EBIT and P/E show up depending on the industry. Whatever the chosen multiple, calculate it for every deal in your dataset.
Then look at the range across all of them, typically reporting the low, median, high, and sometimes the mean. The median smooths out the outliers and gives you a more defensible benchmark.
Step 4: Apply the Multiples to the Target Company
With a defensible multiple range ready, the final step in precedent transactions analysis is applying it to your target company’s financials. Take the multiple range from your precedent deals and apply it to the matching financial metric of the company you're valuing.
If your precedent deals show a median EV/EBITDA of 10.0x, and your target company has an EBITDA of $40 million, your implied enterprise value for the company is $400 million (40×10). You can do this across the low, median, and high multiples from the dataset to get a valuation range instead of a single number.
Also, precedent multiples should be applied to the same metric they were calculated from. If your transaction multiples were based on LTM (last twelve months) financials like LTM EBITDA, apply them to your target's LTM figures too — not NTM (next twelve months), or any other forward projection.
Why Precedent Transactions Often Show Higher Multiples
If you look at a football field chart, the PTA range almost always sits higher than public trading comps.
The gap exists mainly because of the control premium, or takeover premium. When an acquirer buys a whole company, they must pay a premium, typically 20% to 40% above the trading stock price, to incentivize a majority of shareholders to give up their ownership. That premium reflects the explicit value of gaining complete operational control over the business.
Another reason why precedent transaction multiples tend to run higher than comparable company multiples is strategic value and expected synergies. Acquirers often consider the cost savings, market access, or technology they can fold into their existing business from the target. A buyer willing to pay for those synergies will bid higher than a public market investor simply buying shares for investment purposes.
There’s also competitive bidding dynamics. M&A deals sometimes involve multiple interested buyers competing for the same target. That competition can push the final price above what any single buyer might have offered on their own, especially in an auction-style sale process.
Precedent Transactions Analysis Example
To put everything together, let’s work through a simplified precedent transactions analysis example. Suppose you're valuing a mid-sized logistics company with an LTM financials EBITDA of $80 million. Through your financial databases, you discover five comparable logistics acquisitions that occurred over the last 24 months, and calculate their EV/EBITDA multiples:
Deal
EV/EBITDA
Deal A
8.5x
Deal B
9.2x
Deal C
11.0x
Deal D
9.8x
Deal E
10.5x
Lining these up, the low is 8.5x, the high is 11.0x, and the median is 9.8x.
Now apply each to your target's $80 million LTM EBITDA:
Low: 8.5x × $80M = $680 million
Median: 9.8x × $80M = $784 million
High: 11.0x × $80M = $880 million
Your PTA suggests the implied enterprise value of the logistics company is somewhere between $680 million and $880 million, with $784 million as the most defensible midpoint estimate.
The most common precedent transaction analysis interview questions assess your commercial judgment in selecting comparable deals, your understanding of PTA vs other valuation methods, and your technical ability to apply deal multiples.
Here are a few sample questions you can use for practice.
1. Walk me through a Precedent Transactions Analysis.
A Precedent Transactions Analysis (PTA) values a company based on valuation multiples from comparable past M&A transactions. Multiples such as EV/EBITDA or EV/Revenue are applied to the target company’s financial metrics to estimate its Enterprise Value.
2. What are the main weaknesses or limitations of PTA?
The major limitation of PTA is that data availability can be incredibly sparse, especially for private company deals where financials aren't disclosed in public filings. Also, scrubbing financials to get normalized figures can be difficult because no two deals are perfectly identical. Market conditions, interest rates, and buyer motivations vary widely over time. A deal done during a market peak three years ago may not accurately reflect what a buyer would pay today.
3. How do you calculate the purchase price (Transaction Value/Enterprise Value) of a target in an M&A deal?
Enterprise Value (EV) = Offer Price per Share × Diluted Shares Outstanding + Target's Total Debt + Preferred Stock + Non-controlling Interest - Cash
4. How do you adjust for different market conditions or economic cycles when looking at older precedent deals?
You can normalize the transaction metrics. If a deal was done during a massive market boom, you might discount the multiple, or you can limit your dataset to deals completed under similar macroeconomic environments.
Conclusion
Precedent Transactions Analysis involves looking at what buyers actually paid for similar companies, and using that as your benchmark. You select comparable deals, gather their data, turn that data into multiples, and apply those multiples to your target.
What makes PTA valuable is that every number in your dataset comes from a real, completed transaction. Master the four steps including their details like scrubbing financials, spreading multiples, and explaining why a control premium drives valuations higher, and you will easily navigate this topic in any M&A or investment banking interview.