When it comes to case interviews, data interpretation is a crucial skill that sets top candidates apart. Whether you're analyzing market trends, customer segments, or financial figures, your ability to quickly understand and communicate data-driven insights can make or break your performance. In this guide, we'll break down the process into three simple steps to help you excel in reading and interpreting charts and data during your interviews.
Two Types of Data Interpretation in the Recruiting Process
When preparing for your career in consulting, you'll encounter two primary scenarios where data interpretation comes into play:
Solving specific tests (like the McKinsey Solve Game): This requires precise calculations and often involves mental math.
Analyzing and communicating business insights: This is the core of case interviews, where you’ll need to interpret data, connect it to the case context, and use it to drive the discussion.
This article will focus on the second aspect: how to analyze and communicate business insights in a case interview.
If you're interested in improving your skills for specific tests, be sure to check out our resources on the McKinsey Solve Game and BCG Online Case.
McKinsey Imbellus Solve Game Secrets
McKinsey Imbellus Solve Game Secrets
4.7
175 Reviews
Learn the Exact Steps to Crack the 7 Games of the Imbellus
Discover the Proven Way to Master the 5 Skills Tested in the Game
Create your Ecosystem Chain Automatically with the Automated Excel Included
Learn the Exact Steps to Crack the 7 Games of the Imbellus
Discover the Proven Way to Master the 5 Skills Tested in the Game
Create your Ecosystem Chain Automatically with the Automated Excel Included
A Three-Step Guide to Reading Charts and Data in Case Interviews
In a case interview, you won’t be solving straightforward math problems, instead, you’ll be tasked with interpreting data to uncover business insights. Data in various forms is likely to make an appearance in many different types of cases. For example, when you ask for market, customer, or cost information while analyzing the case, the interviewer may provide you with a slide that has a few graphs detailing the various segments of the target market and several numbers (revenue, growth, etc.) pertaining to the segments. To work with this data effectively, you can follow a simple three-step approach: analyze, contextualize, and interpret.
Step 1: Analyze – Understanding the Data
When you're presented with data during a case interview, the first step is to analyze it thoroughly. There are three forms in which the data can be presented to you:
Only numerical data is in a tabular form.
Bar or pie charts with markings on the axes indicating units and reference data points.
A mixture of tabular and graphic representations of data.
Start by examining the exhibit. Reading the title will give you an initial understanding of what the data represents. Pay close attention to the axes, units, and labels, as these elements clarify what's being measured. For instance, if you're analyzing market size, quickly identify the most relevant numbers such as revenue and growth rates and use them to work through your analysis.
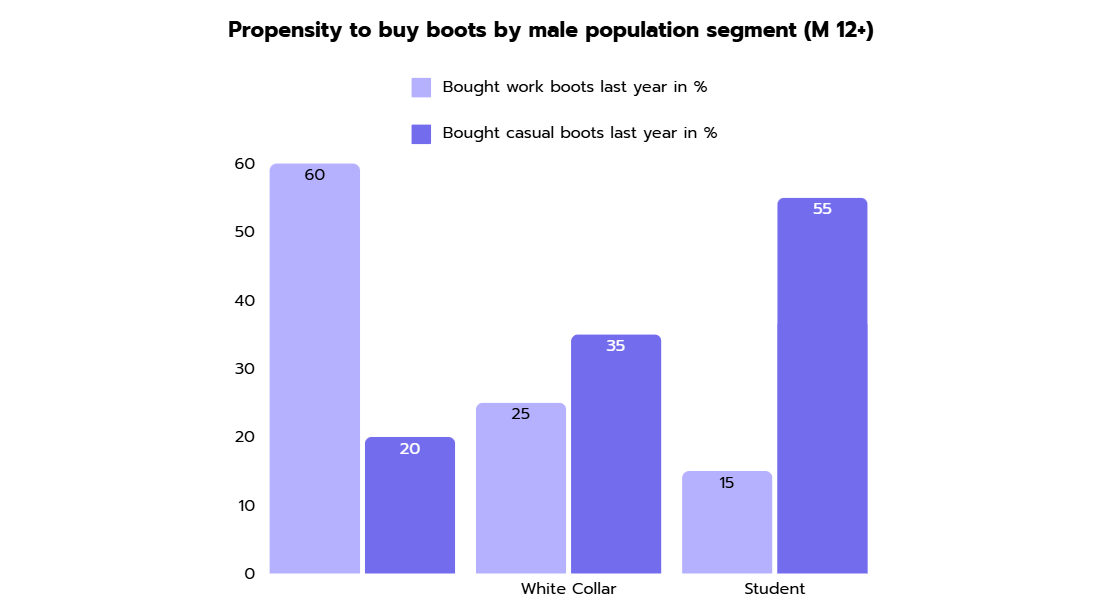
Example: Suppose you're working on a case for a boot manufacturer that produces two types of boots: work boots and casual boots. You're tasked with planning a strategy in response to a competitor launching a new product. To understand the market, you ask the interviewer for market size data, and you're presented with the following exhibit:
Take the following steps to analyze this data:
Keep the question in mind: Always remember the question you asked the interviewer when they handed you the exhibit. Your primary job is to answer that question. In this case, you're focused on determining the market size – a figure in euros. Therefore, you must assimilate all the customer segmentation, product, and pricing data into the total market size.
Study the exhibit: Begin by reading the title of the exhibit and then studying the axes and units of the data. This will tell you what the data is about. In this case, the exhibit is a mixed chart with both numerical and graphical representations. The first part shows buying propensity (the percentage of the population that bought boots last year). The data is presented as a percentage for different customer segments. Additionally, you have the average price paid and total population for each segment.
Work the math: Figure out the most efficient approach to get to the final result, and do the calculations. If all the required data isn’t present, don’t hesitate to ask for it.
For instance:
Total revenue from all customers would equal the market size.
Total revenue = Number of boots bought * Price per pair
Number of boots bought = Number of buyers * Boots bought per buyer
Number of buyers = (Total Population) * (% of the population buying boots)
Now, do we have all the information required to calculate the revenue? Not quite yet. You need to know the number of boots bought per capita by each consumer segment. Quickly explain your approach to the interviewer and ask for the required information. Suppose the interviewer asks you to assume that every customer bought just one pair of boots in the last year.
Now, you have all the information needed to calculate the market size for the total boots category. However, you cannot calculate the size of the work boots versus casual boots market separately since you only know the overall average price and not the category average for each. While these individual prices for the categories can technically be calculated using simultaneous equations, it’s overkill for a case interview, so you should ask the interviewer for this information to calculate the different segments.
After completing the calculations, let's make some straightforward observations. Blue-collar workers buy more work boots than casual boots. Since they’re paying more than others on average, it could imply that work boots are more expensive than casual boots. Additionally, the work boot category is significantly larger than the casual boot category.
Step 2: Contextualize – Connecting Data to the Case
After analyzing the data, the next step is to contextualize it within the broader case. This means linking the numbers back to the overall business problem you're trying to solve. For instance, relating the data to the case objective is crucial. If the case is about entering a new market, consider how the market size data influences your decision-making process. A large, growing market might suggest a strong opportunity, but you must also consider factors like competitive intensity and customer needs.
By contextualizing the data, you ensure that your analysis supports a strategic recommendation. This means not just identifying what the data says, but also why it matters to the client’s goals. For instance, if the data reveals that a specific customer segment is both sizable and underserved, your strategy might focus on targeting this segment with a tailored product offering. This approach not only answers the immediate case question but also aligns your recommendation with the broader business objectives of growth and market penetration.
In our boot manufacturer example, if you’ve determined that the work boot segment is larger and more profitable, and that it’s primarily driven by blue-collar workers, this information will guide your strategy. You might hypothesize that focusing on the work boot segment could be the most effective strategy for capturing market share from the new competitor, especially if you identify opportunities to differentiate your products or address unmet needs in this segment as a competitive response.
Step 3: Interpret – Drawing Insights and Driving the Discussion
The final and most important step is synthesizing all the analysis and business reasoning that you just completed and presenting it to the interviewer effectively. Communicate your insights clearly and concisely, ensuring that your conclusions are backed by the data. This approach not only demonstrates your analytical skills but also shows that you can use data to make strategic business decisions.
In our boot manufacturing example, this could look as follows:
"Our strategy should focus on further capturing the blue-collar worker segment, which is the most profitable for our work boots category. This segment accounts for [X]% of our total revenue, with an average price of [Y] euros per pair—higher than other segments. Given its significant contribution and [Z]% growth over the last [A] years, we should enhance product features such as durability and safety to meet their specific needs. Additionally, targeted marketing and partnerships with industrial employers or safety equipment suppliers could expand our reach and strengthen our position in this key market."
Based on the Pyramid Principle of effective communication, the recommendation is communicated upfront, followed by the supporting data and rationale. Moreover, the hypothesis is clearly tied to specific data points, making the reasoning behind the strategy transparent and grounded in the analysis.
Extra Tips to Work with Data and Charts in Case Interviews
Mastering data interpretation requires more than just understanding the process during the interview; it’s also about thorough preparation. The following tips will help you sharpen your skills:
1. Practice with Real Case Studies.
One of the most effective ways to prepare is by working through real case studies that include data-heavy exhibits. This will not only help you get familiar with the types of data presentations you might encounter, but it will also improve your ability to quickly extract relevant insights under time pressure. As you practice, focus on interpreting different types of charts, such as bar charts, line graphs, and pie charts, as well as numerical tables.
To really get comfortable interpreting data under pressure, simulate the interview environment. Set a timer, review a case with a data exhibit, and practice explaining your analysis and conclusions out loud. The best way to do this is by conducting mock interviews with peers. Check out our Meeting Board to find like-minded candidates to practice with. This will not only improve your speed and accuracy but also help you build the confidence needed to communicate your findings effectively in a real interview.
👉 Start your preparation with the following data-heavy cases.
Duraflex is a German footwear company with annual men’s footwear sales of approximately €1 b.They have always relied on the boot market for the majority of their volume. In this market they compete with three other major competitors.In the fall of 2019, Badger – one of Duraflex’s competitiors – launched a new line of aggressively priced work boots. The strong success of this line has caused Duraflex’s management to re-evaluate their position in work boots.With limited additional resources, the management must now decide if they should focus their efforts on competing with Badger in the work boot sector, or allocate their resources on further strengthening their position with casual boots. The management team approached you and asked for your advice. In order to advise them on their future work boot strategy please prepare first some insights regarding market size and competitive landscape.
Your client is a holding company that has three larger companies in its portfolio. The successful portfolio has developed very dynamically over the last two years and the companies are facing different challenges. The management takes this situation as an opportunity and wants to carry out a portfolio optimization. As a consultant, you are first asked to carry out a portfolio analysis and then to prepare recommendations for action for the portfolio decisions.
Espresso Whatelse is an Italian company that produces coffee and espresso machines since 1908. It is the Italian market leader and has a strong presence overall in Europe. In 2019, Espresso Whatelse has increased its revenues but it has seen declining profit margin.Your client wants to understand the root causes of this 2019 trend and how to increase its profit margin again.
Although many cases don’t require complex calculations, being quick with mental math can significantly speed up your analysis. Work on improving your mental arithmetic, especially in areas like percentages, ratios, and basic multiplication/division.
👉 Do you already know our Mental Math Tool? Use it to get your skills up to speed.
Mental Math Tool
Train your mental math skills and compete with the community!
3. Familiarize Yourself with Common Data Representations.
Charts and graphs come in many forms, and each has its nuances. Spend time learning about different types of data representations – such as histograms, scatter plots, and stacked bar charts – and understand when and why they are used. This familiarity will allow you to quickly interpret the data during your interviews, as you’ll already know what to look for and how to analyze it.
Final Thoughts About Charts and Data in Case Interviews
By following our three-step guide – analyzing the data, contextualizing it within the case, and interpreting it to drive the discussion – and integrating our preparation tips into your study routine, you’ll be well-equipped to tackle any data-heavy case interview with confidence. Remember, the key to success in these interviews isn’t just about crunching numbers; it’s about turning those numbers into actionable business insights. Keep practicing, stay curious, and approach each case with a strategic mindset.
Let's Move On With the Next Articles:
Case Leadership
Consulting Skills & Preparation
You've already learned the basics of case cracking, but now it's time to focus on how to take charge and steer the interview like a pro. Leading a case is all about showcasing your problem-solving skills, structuring your thoughts, and confidently guiding the discussion. Ready to master this crucial skill? Let's get into it!
In a case interview, it’s not just about analyzing the problem, but also about presenting a convincing and actionable recommendation. At the end of your case interview, you'll often get the chance to summarize your solution and present your recommendations. This is your moment to demonstrate that you’ve both understood the issue and developed a clear action plan!
Creativity is a crucial skill assessed during case interviews. While traditional case interview preparation often emphasizes analytical and quantitative abilities, creativity is equally important. This skill demonstrates a candidate's ability to think outside the box, develop a wide array of viable ideas, and propose innovative solutions. In this article, we will explore why creativity is vital in case interviews, how interviewers assess it, and strategies to ensure you never run out of creative ideas during your case-solving process.