Use a 2x2 Matrix in Your Case Interviews as a Visual Summary of Your Findings
If it fits the situation, using a matrix in your case interview can be a great way to demonstrate clear, structured thinking. It helps break down complex problems and present them in a simple, logical way.
Let’s Take a Look at an Example for a 2x2 Matrix:
In order to make an investment decision, we need to analyze the potential business areas in which we should continue to invest.
Two key factors play a crucial role here: importance to the company, measured by the business area's share of total sales, and expected performance, particularly projected growth. These insights give a clear picture of long-term profitability and strategic value, helping you make better decisions.
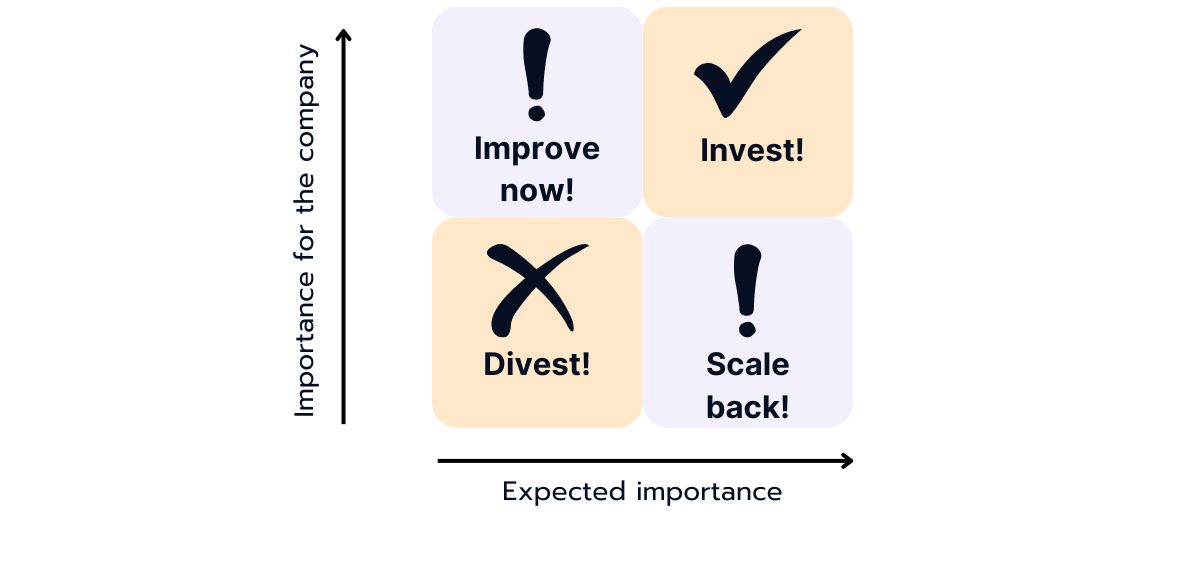
Now you can place the business areas in the individual quadrants of the matrix, then look at the position of each business unit in the matrix and derive decisions from this:
Divest: Check whether it makes sense to withdraw resources from business areas in the "Divest" quadrant and invest them in areas with higher potential. Divesting is most likely the best option for business areas with low importance for the company and a low expected performance.
Improve Now: Business units with a high importance for the company, but low expected performance, should be improved as soon as possible. Identify measures to strengthen their strategic importance.
Scale back: Business areas with high growth potential, which indicates that the market as a whole is expanding and that there are opportunities for growth. However, they currently only have a small market share, which means that they are not the dominant players in the market and may have to fight against strong competition.
It could be considered to reduce their activities or resources. This allows the company to deploy resources more efficiently and focus on business areas with higher potential.
Invest: Prioritize investments in business units in the "Invest" quadrant to maximize their growth potential. This applies for business units with a high importance to the company and high expected performance.
By using this matrix, you can systematically structure investment decisions and ensure that your resources are deployed where they will add the most value to the business. But keep in mind that business unit performance should be monitored regularly, and the investment strategy should be adjusted to ensure that it continues to meet business needs.
The Most Important Facts About the General 2x2 Matrix:
➡ A 2x2 matrix is a visual representation organizing information into four quadrants based on two decision criteria.
➡ 2x2 Matrices facilitate quick prioritization of options by categorizing them into dimensions such as "important/not important" and "high/low growth potential."
➡In consulting contexts, the 2x2 matrix is commonly employed to offer a clear overview of strategic options and make structured decisions on complex matters.
The Best-Known 2x2 Matrix is the Growth-Share Matrix (BCG Matrix)
The growth share matrix, also known as the BCG matrix, is perhaps the best-known example of a two-by-two matrix.
It helps you evaluate your company's product portfolio by considering factors like the product life cycle and experience curve. Since these can be hard to measure directly, market growth and relative market share serve as useful proxies. By mapping your products on the matrix using these indicators, you can make smarter decisions about where to invest or when to divest.
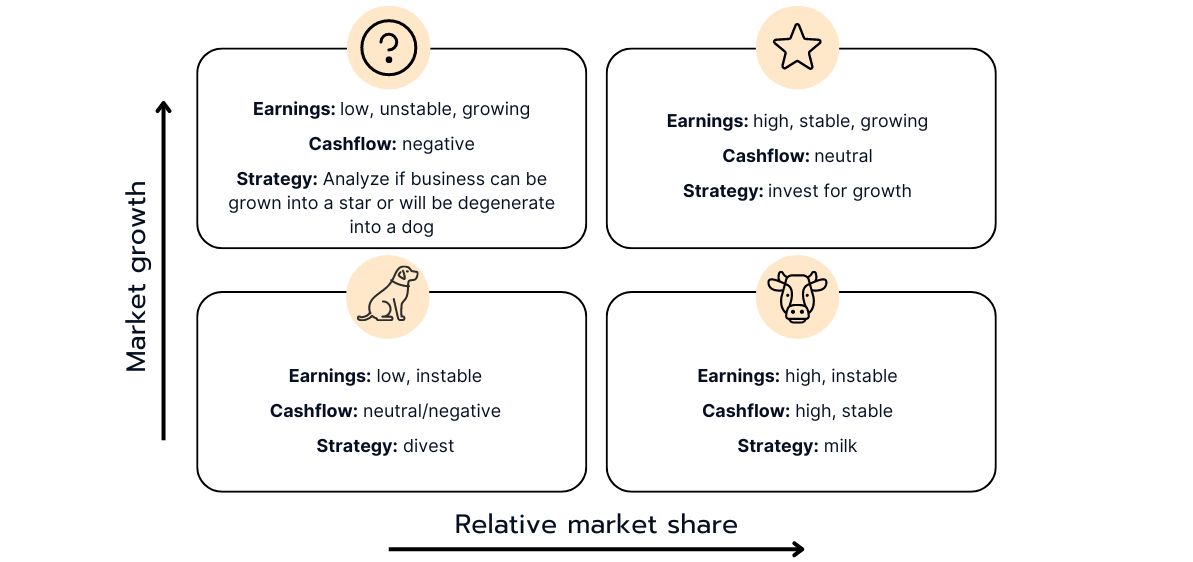
Poor Dogs:
These are products or businesses with a low market share in a slow-growing market. Poor dogs usually generate little or no profit and often require significant investment to rescue or revitalize them. If this is not successful, it may be advisable to divest them.
Question Marks:
These are products or business areas with a low market share in a fast-growing market. Question marks often require considerable investment to increase their market share and become stars, but there is also a risk that they will not develop successfully and become "poor dogs", i.e. unprofitable products or business areas.
Cash Cows:
This refers to products or business units that have a high market share in a slow-growing market. Cash cows usually generate a high cash flow and require relatively little investment to maintain their position. They are often leaders in established markets and have stable profitability.
Stars:
Stars are products or business areas with a high market share in a fast-growing market. They often require significant investment to fully realize their growth potential, but they also have the potential to become future cash cows. Stars are typically in markets where the growth potential is high but the market share is not yet stabilized.
The Most Important Facts About the Growth-Share Matrix (BCG Matrix):
➡ The Growth-Share Matrix assists in determining investment or divestment strategies.
➡ Ideally, a product progresses from a question mark to a star and eventually to a cash cow.
➡ Note: This framework is referred to as the BCG matrix specifically when interviewing with BCG; otherwise, it's known as the growth-share matrix. However, please do not say "I am now using the BCG Matrix" during a BCG interview.
Analyze Revenue Growth Options for a Company Using the Ansoff Matrix
Alongside the BCG matrix, the Ansoff matrix is among the most familiar two-by-two matrices. Created by mathematician and economist Igor Ansoff in 1957, it's employed for choosing appropriate growth strategies in entrepreneurship. This matrix outlines four clear strategic options: Market Penetration, Market Development, Product Development and Diversification.
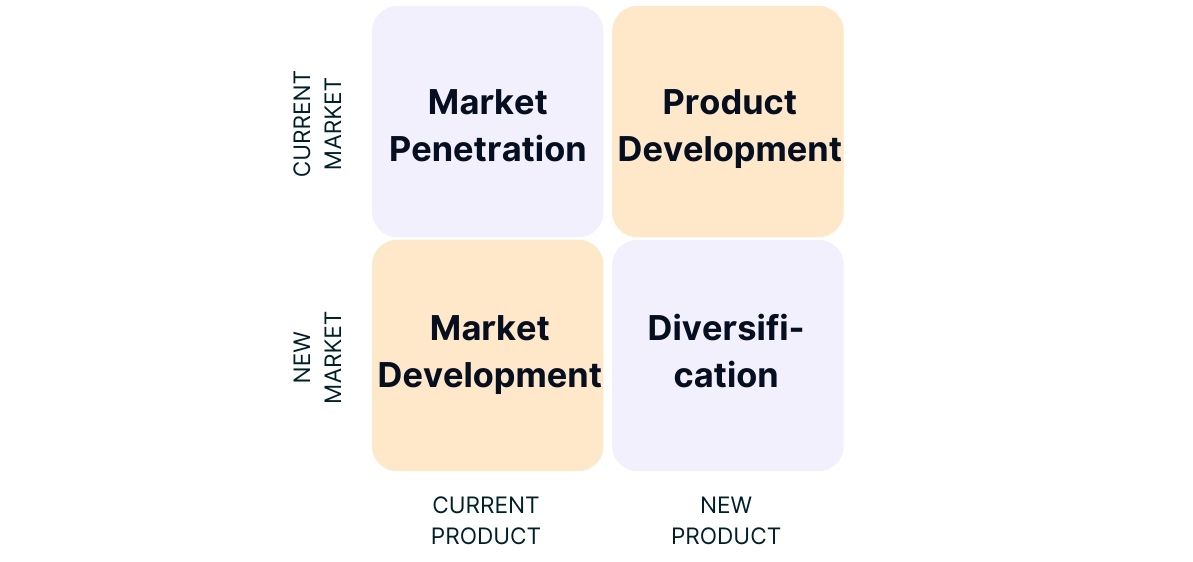
Market Penetration:
In a market penetration strategy, the company focuses on selling more of its existing products or services to its existing customers. The aim is to increase market share by either acquiring more customers or selling more to existing customers. This can be done through price reductions, promotions, improving customer service or introducing new sales channels.
Market Development:
When the focus is on the market development strategy, the company expands by extending its existing products or services to new markets. This could mean geographical expansion by expanding into new regions or countries, or reaching new customer segments by directing its products or services at new target groups.
Product Development:
The product development strategy involves the development of new products or services for existing markets. The company uses its existing market knowledge and customer relationships to develop new offerings that better meet the needs of its customers or address new needs.
Diversification:
In the diversification strategy, the company strives for growth by developing new products or services for new markets. The three diversification strategies include horizontal, concentric and lateral diversification.
Horizontal diversification:
New products may have nothing to do with the current offering, but could appeal to existing customers.
Example: A company that previously only manufactured household appliances like refrigerators and washing machines starts producing consumer electronics such as televisions and speaker systems. These new products are unrelated to the existing household appliances, but may appeal to the same customers who are interested in home electronics.
Concentric diversification:
New products often complement the current offering and may appeal to new customers.
Example: A manufacturer of sportswear expands its product portfolio to include fitness equipment. The new products (fitness equipment) complement the existing offerings (sportswear) and can attract both existing customers and new customers who lead an active lifestyle and want to improve their fitness.
Lateral diversification:
New products have no relationship or synergy with the current offering.
Example: A food manufacturer that has previously only produced snacks ventures into the financial services industry and now offers credit cards. The new products (credit cards) have no relationship or synergy with the current offerings (snacks) but open up entirely new markets and customers.
The Most Important Facts About the Ansoff Matrix:
➡ The Ansoff Matrix provides insights into how future growth can be achieved.
➡ The Ansoff Matrix distinguishes four strategies: market penetration, market development, product development, and diversification.
➡ Each strategy in the Ansoff Matrix presents different levels of growth and risk potential.
Are You Looking for Cases Where You Can Apply These Matrices?
Check out our recommended resources or explore the Case Library for all cases on this topic.