Key Financial Analysis Ratios
1. Liquidity Ratios
Liquidity Ratios indicate whether a company can reliably meet its short-term liabilities. Strong liquidity suggests financial stability and reduces the risk of cash flow shortages—a critical factor for investors and lenders.
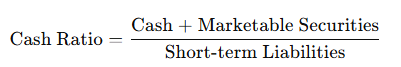
Cash Ratio
This ratio shows if cash and easily liquidated securities are sufficient to cover short-term liabilities. It is calculated by dividing cash and liquid securities by short-term liabilities. A ratio of 1 or higher is considered good, as it indicates the company can fully cover its short-term debt with immediately available funds.
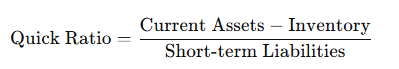
Quick Ratio
The Quick Ratio is calculated by dividing current assets—excluding inventory—by short-term liabilities. This ratio considers only assets that can be quickly converted to cash, such as receivables and cash equivalents, as inventory is often harder to liquidate in the short term. An ideal Quick Ratio is 1 or higher, indicating that the company can cover its short-term debts without relying on inventory sales.
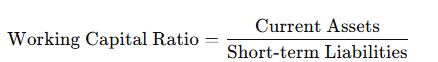
Working Capital Ratio
The Working Capital Ratio is calculated by dividing current assets by short-term liabilities. It indicates whether the company has enough short-term assets to cover its short-term debts. A ratio above 1 is seen as positive, as it shows the company has more current assets than short-term liabilities, indicating good financial health and sufficient liquidity to meet ongoing obligations.
2. Debt-to-Equity Ratios
The Debt-to-Equity Ratio measures the proportion of debt to equity, indicating how heavily a company is financed through debt. A high Debt-to-Equity Ratio suggests a stronger reliance on debt financing, which can mean higher risks but also greater financial leverage for growth projects.
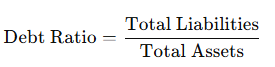
Debt Ratio
The Debt Ratio is calculated by dividing total debt by total assets and expressing the result as a percentage. This ratio shows the extent to which the company relies on debt to finance its assets. A lower Debt Ratio is generally viewed positively, as it suggests a greater portion of assets is financed through equity, indicating a more stable financial foundation.
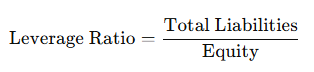
Leverage Ratio
Leverage represents the ratio of liabilities to equity and reflects how much the company relies on borrowed capital to finance its growth. High leverage can increase potential returns but also raises risk, as the company becomes more dependent on creditors.
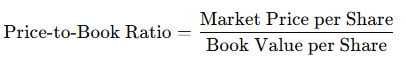
Price-to-Book (P/B) Ratio
The Price-to-Book Ratio indicates whether the company is over- or undervalued by the market. A P/B Ratio above 1 suggests that the market values the company higher than its book value, which could imply a positive outlook or strong investor confidence.
Balance Sheet Analysis and Interpretation in Case Interviews
In consulting case interviews, a solid understanding of balance sheet analysis is essential. You’ll need to quickly assess a company’s financial strengths and weaknesses to provide strategic recommendations based on the balance sheet and other financial data. Key balance sheet items can offer valuable insights into a company.
What you can read from the assets:
- Cash: A high cash balance may indicate strong financial performance, but can also suggest the company is waiting for the right investment opportunities.
- Inventory: Large inventories can tie up capital and increase storage costs. Growing inventory levels may also signal declining sales.
- Accounts Receivable: The faster a company collects receivables, the better, as this minimizes the risk of bad debts.
- Long-term Assets: This includes assets like property and machinery, which are often essential for operations but harder to liquidate. The level of long-term assets varies significantly across industries.
What you can read from the liabilities and equity:
- Short-term Liabilities: These are usually manageable, but they can pose a risk during cash flow shortages if the company struggles to meet them on time.
- Long-term Liabilities: Loans and debt can offer tax benefits, but high interest costs and debt levels may threaten financial stability.
A balance sheet should always be analyzed in the context of the industry and company strategy, as asset and financing structures can vary greatly. Capital-intensive industries, like manufacturing, often have high levels of long-term assets, while service companies typically have a lighter balance sheet structure. The level of debt also depends on the industry: Companies with stable cash flows often use more debt, while those in volatile industries rely more on equity to maintain flexibility.
Key Takeaways for Balance Sheet Analysis
- Fundamental Importance: The balance sheet provides a snapshot of a company’s financial position and forms the basis for strategic consulting decisions.
- Asset and Liability Analysis: Assets (cash, inventory, long-term investments) and liabilities (short- and long-term debt) offer insights into a company’s liquidity and financing structure.
- Key Ratios for Evaluation: Ratios like the Cash Ratio, Quick Ratio, and Debt Ratio help assess financial stability and compare the company to its peers (benchmarking).
- Role of Equity: Equity reflects financial independence and shows how well a company is protected against risks.
- Relevance in Case Interviews: In case interviews, you must be able to quickly and accurately analyze balance sheets to assess a company’s financial strength and make informed recommendations.