The Compound Annual Growth Rate (CAGR) is an essential metric for consultants, especially when comparing long-term growth scenarios. It represents the average annual rate at which a value (such as a business’s revenue or an investment’s value) grows over a certain period. For consultants, understanding and utilizing CAGR is crucial when projecting future business performance or comparing investments.
Why CAGR is Important for Consultants
Consultants often work with long-term growth strategies, typically spanning over several years (e.g., five years). These strategies are based on a company’s goals and the measures implemented to achieve them. Since yearly growth rates can fluctuate due to one-off events or external factors, simply comparing year-on-year (YoY) growth rates does not give an accurate picture. The CAGR helps smooth out these fluctuations by assuming a steady growth rate over the entire period.
For example, a company may experience significant growth in some years and stagnation or decline in others. By using the CAGR, consultants can determine the average annual growth rate over the entire period, providing a clearer view of a company’s overall performance.
CAGR in Case Interviews
While it’s unlikely that you’ll be asked to calculate the CAGR during a case interview, understanding its meaning, calculation, and application is essential. Many case studies presented in interviews involve analyzing business performance over time. Knowing when and how to apply the CAGR will help you navigate these scenarios effectively. Case interviews often involve comparing growth rates or forecasting future revenue – both situations where CAGR becomes highly relevant.
💡 Check out our Case Library and try to use the CAGR in a real case study.
How to Calculate the CAGR
The formula for CAGR is:
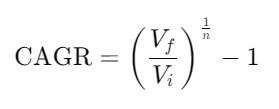
Where:
- Vf = the final value (e.g., revenue at the end of the period)
- Vi = the initial value (e.g., revenue at the beginning of the period)
- n = the number of years or periods
CAGR Example
Let’s say a company’s revenue was €0.8 million in 2006 and increased to €1.8 million in 2013. To calculate the CAGR over this 7-year period, you can apply the formula:
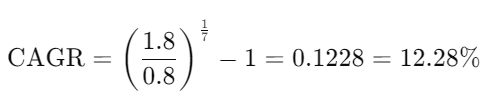
This result shows that the company’s revenue grew at an average rate of 12.28% per year from 2006 to 2013. In other words, if the company had grown steadily at this rate each year, its revenue would have increased from €0.8 million to €1.8 million by 2013.
💡Do you need to freshen up your mental math skills? No problem with the help of our Mental Math Tool.
Simple Growth vs. Compound Growth
It’s important to understand the difference between simple growth and compound growth. Simple growth is a direct percentage increase over a single period, such as one year.
In contrast, compound growth accounts for growth over multiple time periods, where the growth applies not only to the initial value but also to the accumulated gains. This is why CAGR is sometimes referred to as "compounding" growth—it calculates the rate at which an investment or business grows when you account for growth on growth, year after year.
For example, if a company grows by 10% in one year, the growth in the following year is not just based on the original value but also on the increase from the first year. Over time, this "compounding effect" can significantly amplify growth.
Simple Growth Rate vs. Compound Growth Rate
The simple growth rate measures the percentage change over a single period (e.g., one year) and is calculated as:

For instance, if a company’s revenue increased from €0.8 million in 2006 to €1.0 million in 2007, the simple growth rate would be:
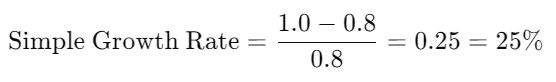
However, unlike CAGR, simple growth does not account for compounding—i.e., growth on top of growth over multiple periods.
Applications of CAGR
CAGR has a variety of applications that make it a valuable tool for consultants:
- Project future revenue: By calculating CAGR, consultants can project a company’s future revenue if it grows at a consistent rate.
- Compare investments: Investors and consultants can use CAGR to compare the performance of different investments over the same time period.
- Track business performance: CAGR can help track and analyze the growth of key business metrics, such as revenue, profit, or market share.
- Identify competitive strengths and weaknesses: By comparing CAGR across companies, consultants can identify which companies are growing faster or slower than their competitors.
Limitations and Rules of Thumb
Although the CAGR is useful for simplifying growth calculations, it has certain limitations:
- Ignores interim fluctuations: CAGR assumes a steady growth rate and does not reflect the actual ups and downs during the period.
- End-year bias: All growth could theoretically occur in one year (e.g., the last year) without reflecting the interim performance.
- Rule of 72: To estimate how long it will take for an investment to double, you can use the Rule of 72. Dividing 72 by the CAGR gives an approximate number of years required to double the starting value. For instance, with a CAGR of 12%, it would take approximately 6 years for the company’s revenue to double.
Key Takeaways
- CAGR is a theoretical measure of steady growth over a period, ideal for comparing investments or tracking performance.
- It does not reflect year-to-year volatility or trends.
- Knowing how to interpret and apply the CAGR is critical in consulting and case interviews, where long-term growth projections are often discussed.
- Case Interviews: While you may not be required to calculate the CAGR, understanding its purpose and how to interpret growth scenarios will significantly aid you in handling business cases.