Get Active in Our Amazing Community of Over 452,000 Peers!

Schedule mock interviews on the Meeting Board, join the latest community discussions in our Consulting Q&A and find like-minded Case Partners to connect and practice with!

Case study Pasta and flour

Bain & Company case interview practice with consultants
Edited on Apr 07, 2022
2 Answers
973 Views
Tyler Tan asked on Apr 06, 2022


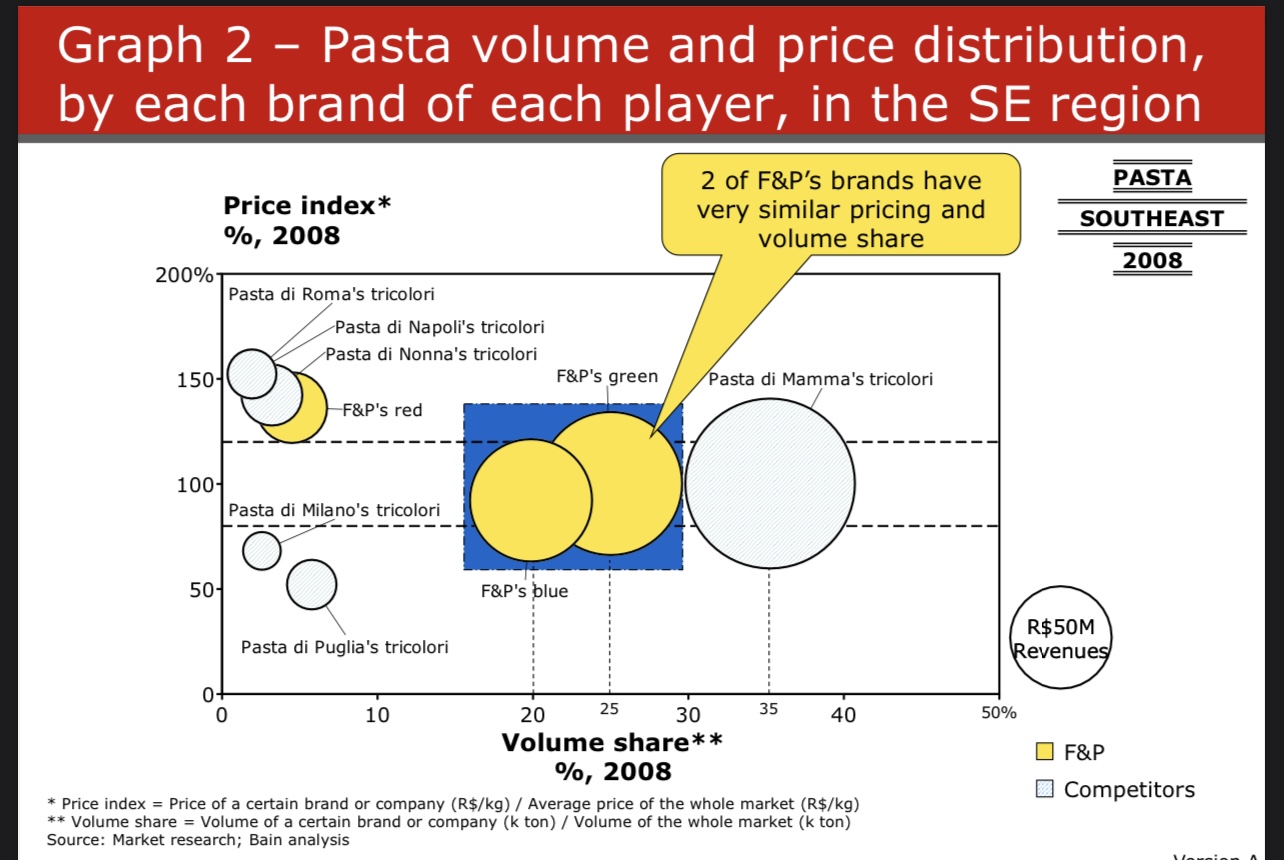
3) If F&P managed to merge two of its pasta brands in the southeast region, blue and green, into a new brand, how much volume would it comprise? (Units: k ton, 2008)

A)70

B)80 

C)180

D)500

could anyone help with this question and provide an explanation on this please? 

-1649254488-4imzajigox65.jpg


Overview of answers

Upvotes
  • Upvotes
  • Date ascending
  • Date descending
Best answer
Andi
Expert
updated an answer on Apr 07, 2022
BCG 1st & Final Round interviewer | Personalized prep with >95% success rate | 7yrs coaching | #1 for Experienced Hires

Hi Tyler,


interesting one, given the really horrible chart.

In this particular case, a mix of eye-balling & sanity-checking will totally suffice.


1. Eye-ball: Compare circles of the 2 to the legend (50m) - you will see that they're approx. 1.5 to 2x the size. Add that up, you'll get around 175m.

2. Sanity-check: eliminate the other answers to be sure: 500m would be 10x the legend - this is clearly not the case. 70m or 80m would be less than 2x the legend - given both companies are clearly more sizeable than the 50m circle, it must be definitely more than 2x 50m. Hence, can eliminate these 3 options.

3. Confirm 180m as your answer


If you don't feel too comfortable with a quick and dirty approach, have a ruler handy, so you can measure radius, just in case. However, would argue that such approach would be a rather over-kill, so try safe the time for more complex problems instead.


Hope this helps! Feel free to reach out, if you have further questions / would like to learn more about useful Maths shortcuts for consulting prep.


Regards, Andi

(edited)

Was this answer helpful?
Ian
Expert
Content Creator
replied on Apr 06, 2022
#1 BCG coach | MBB | Tier 2 | Digital, Tech, Platinion | 100% personal success rate (8/8) | 95% candidate success rate

Don't you just love how these companies throw terrible charts at you and expect you to solve them! :)

Now, luckily this one is easy. Even if it's a very poorly designed chart, we know from the right hand legend that $50M is the side of that circle. Given “Green” is about twice that size, we can safely safe green is about $100M, and given blue is slightly larger, $80M could make sense. As such, the answer is C) 180.

The other numbers are just so far away from what's reasonable!

This is one where you would not want to waste time calculating, but rather eyeball :)

Was this answer helpful?
Tyler Tan on Apr 07, 2022

The answer is 70 for this which I do not know how do they arrive at that answer

Ian on Apr 07, 2022

Honestly, that makes no sense! Are we provided any other information such as absolute price and volume? (i.e. what 25% of volume really means) It's possible you could use Pie R Squared to get the area of each circle...but we can't do that with the current state of the graph.

Ha An on Jun 07, 2023

I think Tyler missed the previous chart which indicates that total volume of the market here is around 156m. So disregard the economies of scale, it's 0.45x156M=70M. If it makes sense :)

Andi gave the best answer

Andi

Premium + Coaching Expert
BCG 1st & Final Round interviewer | Personalized prep with >95% success rate | 7yrs coaching | #1 for Experienced Hires
82
Meetings
4,246
Q&A Upvotes
17
Awards
5.0
26 Reviews