Verabrede dich zum Casen über das Meeting-Board, nimm an Diskussionen in unserem Consulting Q&A teil und finde gleichgesinnte Interview-Partner:innen, um dich auszutauschen und gemeinsam zu üben!
Zurück zur Übersicht

Calculate gross margin using revenue breakdown

Hello! I'm doing a sample case and I'd like to know how can I find what year had the highest gross margin from a chart.

I know the gross margin would be the revenue minus the cost but I know there would be a more simple way since I do not have the cost in this chart but have the revenue breakdown year by year.

This looks like a simple question but I am not 100% sure how I can solve this.How to calculate gross margin using revenue breakdown

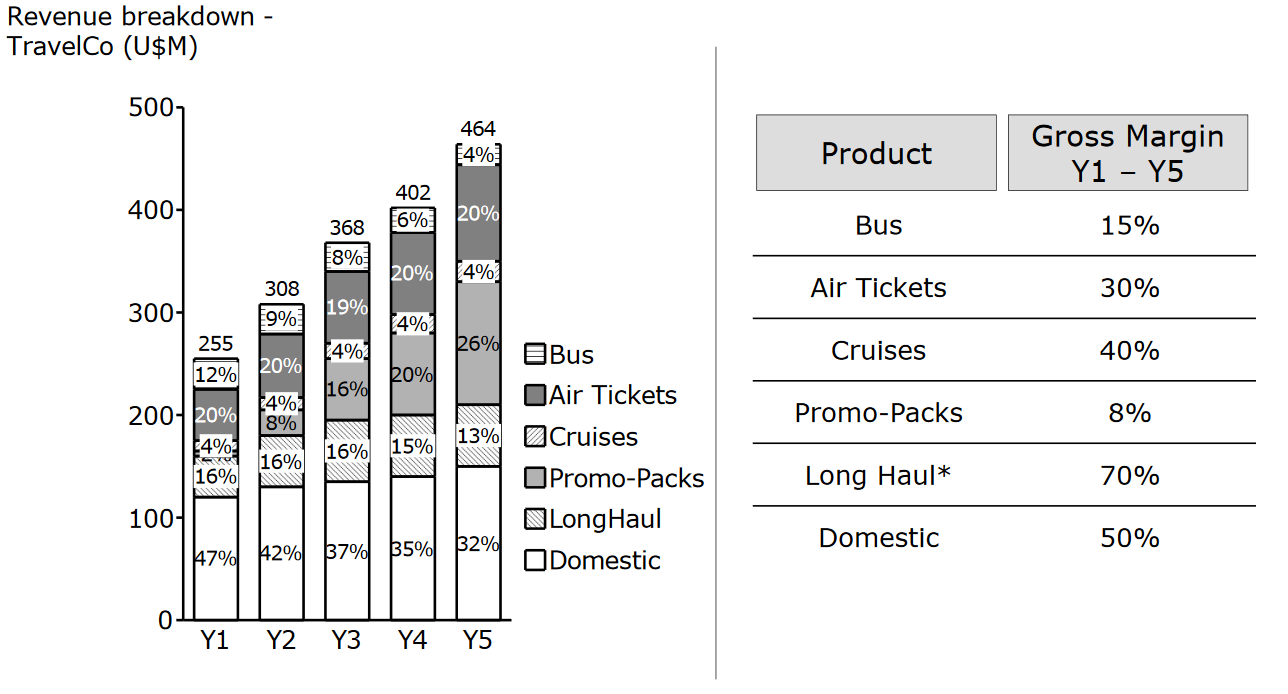
Thanks in advance for the help!

3
4,3k
18
Schreibe die erste Antwort!
Bisher hat niemand auf diese Frage reagiert.
Beste Antwort
Clara
Coach
am 13. Nov. 2023
McKinsey | Awarded professor at Master in Management @ IE | MBA at MIT |+180 students coached | Integrated FIT Guide aut

Hello!

Precisely for the high amount of questions (1) asked by my coachees and students and (2) present in this Q&A, I created the “Math & Formulas - Economic and Financial concepts for MBB interviews”, recently published in PrepLounge’s shop (https://www.preplounge.com/en/shop/prep-guide/economic_and_financial_concepts_for_mbb_interviews).

After +5 years of candidate coaching and university teaching, and after having seen hundreds of cases, I realized that the economic-related knowledge needed to master case interviews is not much, and not complex. However, you need to know where to focus! Hence, I created the guide that I wish I could have had, summarizing the most important economic and financial concepts needed to solve consulting cases, combining key concepts theorical reviews and a hands-on methodology with examples and ad-hoc practice cases.

It focuses on 4 core topics, divided in chapters (each of them ranked in scale of importance, to help you maximize your time in short preparations):

  • Economic concepts: Profitability equation, Break even, Valuation methods (economic, market and asset), Payback period, NPV and IRR, + 3 practice cases to put it all together in a practical way. 
  • Financial concepts: Balance sheet, Income statement/P&L and Performance ratios (based on sales and based on investment), +1 practice case
  • Market structure & pricing: Market types, Perfect competition markets (demand and supply), Willingness to pay, Pricing approaches, Market segmentation and Price elasticity of demand, +1 practice case
  • Marketing and Customer Acquisition: Sales funnel, Key marketing metrics (CAC and CLV) and Churn, +1 practice case

Feel free to PM me for disccount codes for the guide, and I hope it helps you rock your interviews! 

am 24. März 2019

Y1: 0.47x0.5 + 0.16x0.7 + 0.02x0.08 + 0.04x0.4 + 0.2x0.3 + 0.12x0.15 = 0.4426

Y2: 0.42x0.5 + 0.16x0.7 + 0.08x0.08 + 0.04x0.4 + 0.2x0.3 + 0.09x0.15 = 0.4179

Y3: 0.37x0.5 + 0.16x0.7 + 0.16x0.08 + 0.04x0.4 + 0.19x0.3 + 0.08x0.15 = 0.394

Y4: 0.35x0.5 + 0.15x0.7 + 0.2x0.08 + 0.04x0.4 + 0.2x0.3 + 0.06x0.15 = 0.381

Y5: 0.32x0.5 + 0.13x0.7 + 0.26x0.08 + 0.04x0.4 + 0.2x0.3 + 0.04x0.15 = 0.3538

Y1 has the highest gross margin of all years

2
am 22. März 2019

I think you can calculate the gross margin of each year as a weighted average of the gross margin of each of the segments, with the contribution of that segment to the total revenue as the weighing factor. So for each of the years, the overall gross margin would be contribution (bus) * gross margin (bus) + contribution (air tickets) * gross margin (air tickets) and so on, divided by the number of contributions.

To speed things up, you can use the fact that you won't need absolute value to sort them. You can therefore skip the division step, as the number of contributions is the same for each year (6) and that factor effectively cancels out. You can also remove some contributions that are sufficiently small or that are similar and therefore should cancel out - for example, air tickets contribute approximately 20% to the revenue in each of the years, and you will therefore arrive at the same order if you neglect this contribution.

1
am 22. März 2019
Total margin for all years: Y1: 111.5, Y2: 125.37, Y3: 138.58, Y4: 153.2, Y5: 151.86
am 22. März 2019
Am I using this method correctly? Y1: Domestic: (255*47%)*50% = 59.925 Long Haul: (255*16%)*70% = 28.56 Promo: (255*2%)*8% = 0.408 Cruises: (255*4%)*40% = 4.08 Air Tickets: (255*20%)*30% = 15.3 Bus: (255*12%)*15% = 4.59 Y1 = 112.863 Y2 = 64.68 + 34.496 + 1.9712 + 4.928 + 18.48 + 4.158 = 128.7132. However, the correct answer is TravelCo reached highest gross margins (in %) in Y1. I don't think I should be using the Y1-Y5 gross margin in the calculation as I'm trying to figure which year has the highest margin but what should I use instead?
Ähnliche Fragen
Consulting
Case Study Based on CIM
am 12. Juni 2024
Global
4
1,7k
Beste Antwort von
Sanjeev
Coach
PwC/Strategy&/GT/Chicago Booth - 2nd Session Complementary till June 1st
46
4 Antworten
1,7k Aufrufe
+1
Consulting
How should I explain a change in course at university? Will it be asked of me?
am 14. Apr. 2025
Global
10
3,6k
Beste Antwort von
Alessa
Coach
xMcKinsey & Company | xBCG | +200 individual & group coachings | feel free to schedule a 15 min intro call for free
81
10 Antworten
3,6k Aufrufe
+7
Consulting
Just did the Mckinsey Solve Game (January 2025) - got some questions/insights
am 24. Apr. 2025
Global
5
3,8k
Beste Antwort von
Hagen
Coach
#1 recommended coach | >95% success rate | 8+ years consulting, 8+ years coaching and 7+ years interviewing experience
41
5 Antworten
3,8k Aufrufe
+2
Wie wahrscheinlich ist es, dass du uns einem Freund oder Kommilitonen empfiehlst?
0 = Nicht wahrscheinlich
10 = Sehr wahrscheinlich
Vielen Dank für dein Feedback! Deine Meinung hilft uns, PrepLounge noch besser zu machen.