Hello everyone!
Today I have been doing some practices regarding the BCG Potential Test, however I found the following questions which I don't know how to solve it.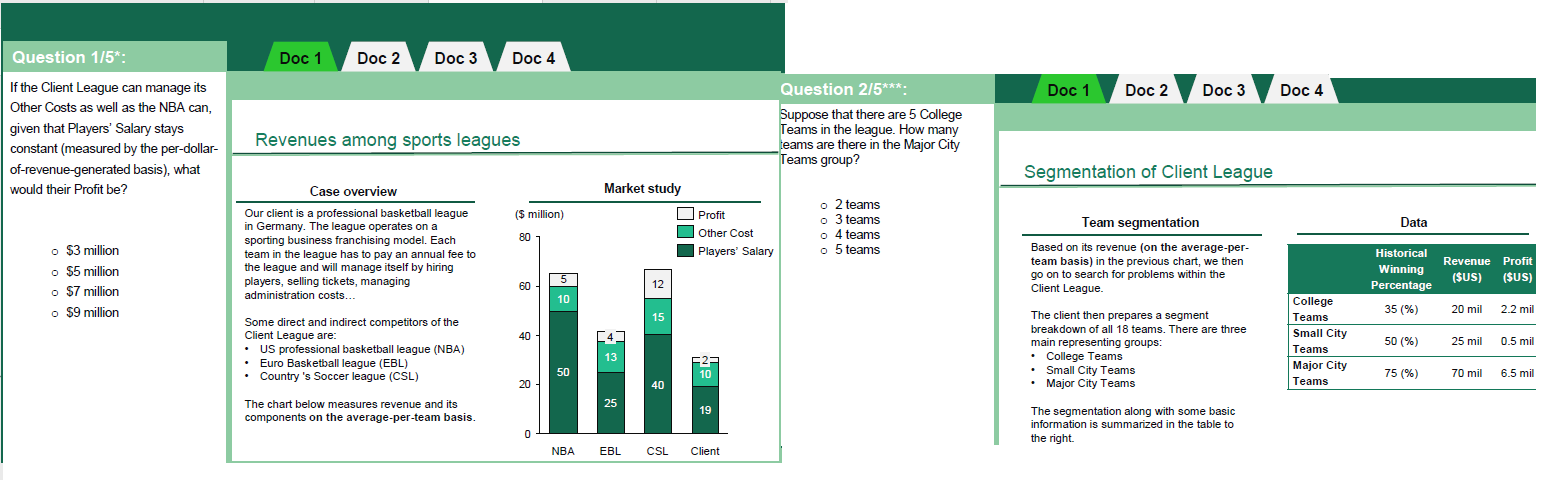
I appreciate your help.
Thank you very much.
Hello everyone!
Today I have been doing some practices regarding the BCG Potential Test, however I found the following questions which I don't know how to solve it.
I appreciate your help.
Thank you very much.

Hi Floyd,
In regards to #1 you have to figure out what % of total revenues the "Other Costs" equals. The NBA's other costs are $10M and they have total revenues of $65M (5+10+50). As such, their other costs are 15.38%.
If our client could have the same cost structure, their "Other Costs" would be $4.77 ($31M times 15.38%). As such, their additional profit would be 5.33 (Current Other Costs of $10M minus the new costs of $4.77 = added pure profit).
Adding the additional profit to their existing profit gets us $7.33M, so the answer is C - $7M

Hi. Even if after a few years, I got interested in this question.
This is a way to solve the question. Information we find:
The revenue column may be confusing, but to make sure we understand it is about avg revenues for EACH team, not the total, just sum the revenues. The total is $115M. If we divide this by 18, we have $6.4M, far lower than the average revenues showed in the previous chart on the right side.
Calculation:
Given it is possible to use the calculator, one quick way is by iteration and a little of judgement. Let's then try choosing a combination of teams, multiplying each team revenues (e.g. college teams is $20M) for the number of teams, and dividing by 18.
If:
I will then drop major teams by 2 as the average was far lower.
If:
I hope this is useful for everyone.