Werde aktiv in unserer Community aus über 451.000 Gleichgesinnten!

Verabrede dich zum Casen über das Meeting-Board, nimm an Diskussionen in unserem Consulting Q&A teil und finde gleichgesinnte Case-Partner, um dich auszutauschen und gemeinsam zu üben!

How to calculate volume after merge from a Price Index - Volume Share chart

business case case question
Letzte Aktivität am 25. März 2019
3 Antworten
2,4 T. Views
Anonym A fragte am 22. März 2019

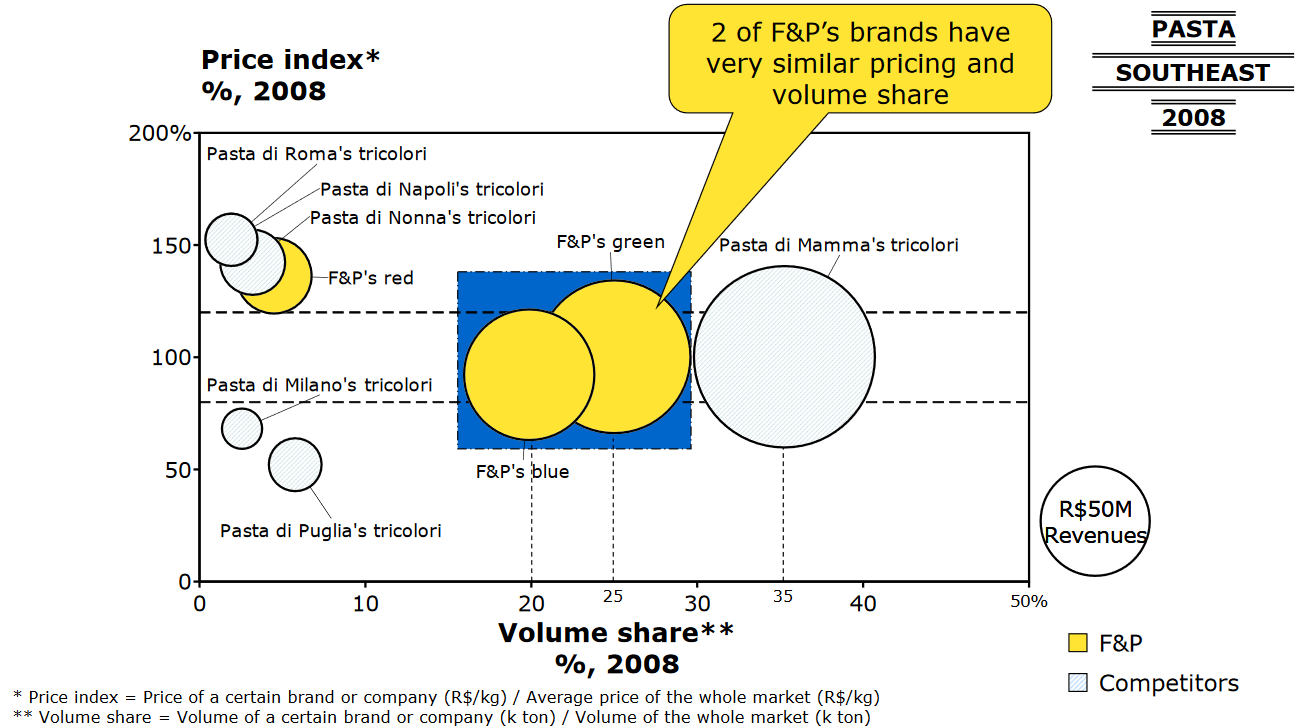
Hi! I'm doing a sample case and I'm not quite sure how to find the volume after the merge of F&P's green and blue.

I know the correct answer is 70 but how do I get there?

My guess is that it will be the sum of both areas but I'm don't know what is the best way of getting this.

Any help would be great!Volume Share chart

Übersicht der Antworten

Upvotes
  • Upvotes
  • Datum aufsteigend
  • Datum absteigend
Eduardo antwortete am 24. März 2019

Hi Alexander

The only other slide about Pasta is this one for value breakdown

I thought about multiplying 49% * $389M to get F&P's total value in Southeast (the merger in question is only in the SE region) and try to use that to know how much would be 20% of the whole market for F&P's blue and 25% for F&P's green.

However 49% * $389M is ~$190M, way over the $50M total revenue from the original chart. And I still don't have any information about how many tons this would be

How can I use this info to get a value in tons? I don't see anything I can do with these slides

How to calculate volume after merge from a Price Index

War diese Antwort hilfreich?
1
Beste Antwort
Artyom antwortete am 25. März 2019

1. We can calculate Revenue per kg for F$P blue and green ( they are 100% price index with avg. market price 2.49, wich means 2.49 per kg. ). (won't consider red for simplicity )
2. We can calulate their total volume, dividing total their total revenue (which we can get from their volume share int SE = 0.49*389 = 191 ) by revenue per kg (2.49) - we get 76.4M
3. Approx 10% of volume attributes to red (from first graph), which means volume after merge is ~70M

War diese Antwort hilfreich?
1
Alexander antwortete am 24. März 2019

I've been looking at this question for longer than I care to admit. Is any other information given? All currently given values are relative to each other, whereas the value you're looking for, the volume, is an absolute value. Technically, the revenues are absolute values, but they don't directly translate into a volume (there's a scaling factor, the price per k ton) and are therefore useless for this question.

War diese Antwort hilfreich?
0
Eduardo am 24. März 2019

Hi Alexander. I posted another comment with the other chart but it's only about value breakdown. Not sure how to use it

Alexander am 25. März 2019

Hi Eduardo, the other slide helps a lot - Artyom posted the correct solution!