Get Active in Our Amazing Community of Over 452,000 Peers!

Schedule mock interviews on the Meeting Board, join the latest community discussions in our Consulting Q&A and find like-minded Case Partners to connect and practice with!

what to do when you completely don't understand a chart

Charts reading
New answer on Mar 06, 2023
5 Answers
679 Views
Anonymous A asked on Mar 05, 2023

Dear community, 

It happened to me several times that I just couldn't understand a chart. I've been practicing…not much progress. Below is an example. The only thing I can grasp from this chart is the sales improved during the two weeks of contest. Can anyone tell me what you see from this chart? (sadly, I don't understand the casebook's answer either.)

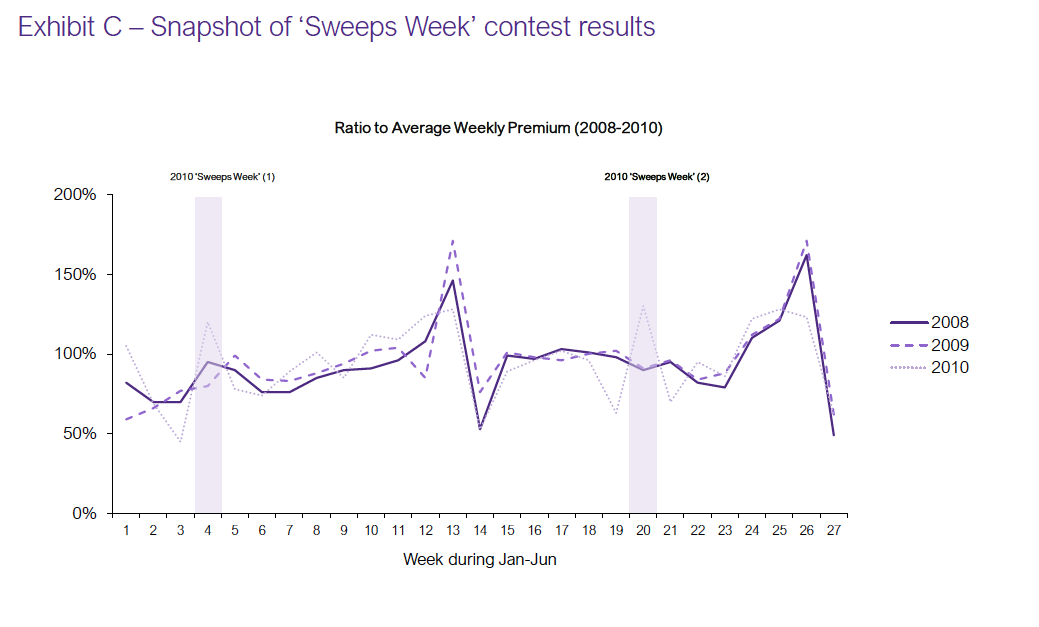
The background is the insurance company has undergone fairly steady growth in the past two years, but profit margin is decreasing. The company launched a contest called ‘Sweeps Week’ that aimed to drive increased premium in weeks that were traditionally low volume for the company. Sales agents thought ‘Sweeps Week’ was a great contest


Overview of answers

Upvotes
  • Upvotes
  • Date ascending
  • Date descending
Best answer
Francesco
Expert
Content Creator
replied on Mar 06, 2023
#1 Coach for Sessions (4.500+) | 1.500+ 5-Star Reviews | Proven Success (➡ interviewoffers.com) | Ex BCG | 10Y+ Coaching

Hi there,

Q: Can anyone tell me what you see from this chart? 

The graph shows that the “Sweeps week” increased the variable on the Y axe (which should be clarified as the label is missing and title is unclear) during the week of activities. 

However this is anticipated and followed by a decline compared to the scenarios where the “Sweeps week” was not present. So as mentioned by Pedro, it seems that the increase in that week was compensated by what happened after and before, although we would need the exact data to be sure.

- - - - - - - - - - - - - - - - - - - - - - - - - - - - - - - - - - - - - - - - - - - - - - - - - - - - - - - - - - - - - - - - - - - -

As general tips for graph analysis, I would recommend the following:

1. READ THE GRAPH

  • Ask for some time to understand the graph. Usually 30 seconds are enough, but there is no hard rule.
  • Summarize the graph. Read in particular the graph title, the legend, and the footnote. Candidates quite often skip this part and then make mistakes.

2. ANALYZE THE GRAPH AND FIND THE KEY INSIGHTS

  • Repeat the question. Some candidates don’t repeat the question and then answer the wrong one. If you repeat it, you can be sure that you will answer what was asked.
  • Provide an analysis related to the question. Identify the key insights of the graph based on the question. This is the most challenging part of graph analysis to master, as it is different in every chart. You can improve it with drills on your own or with coaching.

3. PROPOSE THE NEXT STEPS

  • State your hypothesis or suggestion on what to do next. Present what should be done next to help further the client to reach the goal.
  • Ask a question/propose an analysis related to what is needed to move forward. This will show you are able to drive the case forward.

Best,

Francesco

Was this answer helpful?
Hagen
Expert
Content Creator
replied on Mar 06, 2023
#1 Bain coach | >95% success rate | interviewer for 8+ years | mentor and coach for 7+ years

Hi there,

I think this is an interesting question that may be relevant for many people. I would be happy to share my thoughts on it:

  • I can still remember the case study, and personally, I like it. The key insight to draw from the chart is that after changing the compensation mechanics for "sweeps weeks" for the sales team, the sales team seems to sell a lot less the weeks before and after, and a lot more during "sweeps week". Given the information in the case study that they have a bit of flexibility when it comes to allocating sales to a specific week, it is obvious that the sales team intentionally allocated a lot of sales in the "sweeps weeks" to secure more bonus.
  • Moreover, since it seems that you are not progressing anymore and still struggling with exhibit analyses, I would highly advise you to reach out to a coach about it. Given that this is such a crucial skill to master, I feel there is very little you can do, especially since you have practiced this extensively.

If you would like a more detailed discussion on how to address your specific situation, please don't hesitate to contact me directly.

Best,

Hagen

Was this answer helpful?
Pedro
Expert
replied on Mar 05, 2023
Bain | Roland Berger | EY-Parthenon | Mentoring Approach | 30% off first 10 sessions in May| Market Sizing | DARDEN MBA

I wonder what is the book's answer.

From the chart it is quite obvious that sales increase during the sweeps week vs. previous years. Unfortunately, it is also clear that sales go significantly down in the week before and the week after the sweeps week - meaning that overall the effect of the initiative is… none.

Looks like the salespeople are just postponing (and anticipating) the sales of the weeks before and after.

Was this answer helpful?
Ian
Expert
Content Creator
replied on Mar 06, 2023
#1 BCG coach | MBB | Tier 2 | Digital, Tech, Platinion | 100% personal success rate (8/8) | 95% candidate success rate

Hi there,

Pedro is exactly right here.

Here's how you need to process charts:

  1. Be super clear on objective (front and center)
  2. Summarize the chart in a sentence
  3. Look for differences
  4. Turn those differents into insights
  5. Practice practice practice

If you're still struggling, get a coach! We're here to help you where you're stuck.

Was this answer helpful?
Cristian
Expert
Content Creator
replied on Mar 06, 2023
#1 rated MBB & McKinsey Coach

Hi there, 

This is an interesting question. 

Basically, if you're struggling with this, it likely relates to two factors. 

1. You don't have enough experience 

2. You don't have a good technique for approaching exhibits. 

Point 1 is obvious, so let me focus on what to do about point 2 and then you can resort to just practicing more. 

To read exhibits, you should focus on the following:

1. Read the exhibit with the interviewer when you receive it. Literally, just read it. This gives you the opportunity to understand what sort of data it contains before you even take the thinking time to digest it. You can also ask clarifying questions at this point. Plus, it's more conversational instead of just falling silent the moment you received the prompt. 

2. Then ask for time. Take about 30-45 seconds (high-level estimate) to think about what are the 2-4 main insights/stories that the exhibit is telling you. 

3. Get back to the interviewer and take them through each of these points. Count through your insights and for each of them focus on the data point that inspired you, what that means and what are the consequences for the client (i.e., what should the client do as a consequence of these findings). Aim to connect these insights as much as possible to what you've learned about the client context from the prompt, as well as anything else you might've discovered at some other point in the case. 

4. Once you've laid out the insights, you can take a step back and provide an overall synthesis of what this exhibit tells us about the client and their story. At this point, you can also lay out what are some of the next steps to consider. 

Best of luck and do reach out if you need practice!
Cristian

Was this answer helpful?
Francesco gave the best answer

Francesco

Content Creator
#1 Coach for Sessions (4.500+) | 1.500+ 5-Star Reviews | Proven Success (➡ interviewoffers.com) | Ex BCG | 10Y+ Coaching
4,528
Meetings
45,683
Q&A Upvotes
397
Awards
5.0
1623 Reviews