
In one of my case practices the following exhibit came up. I don't understand how they calculated yearly revenue from the exhibit, but I've attached the answer from the guidance.
I have 2 Qs:
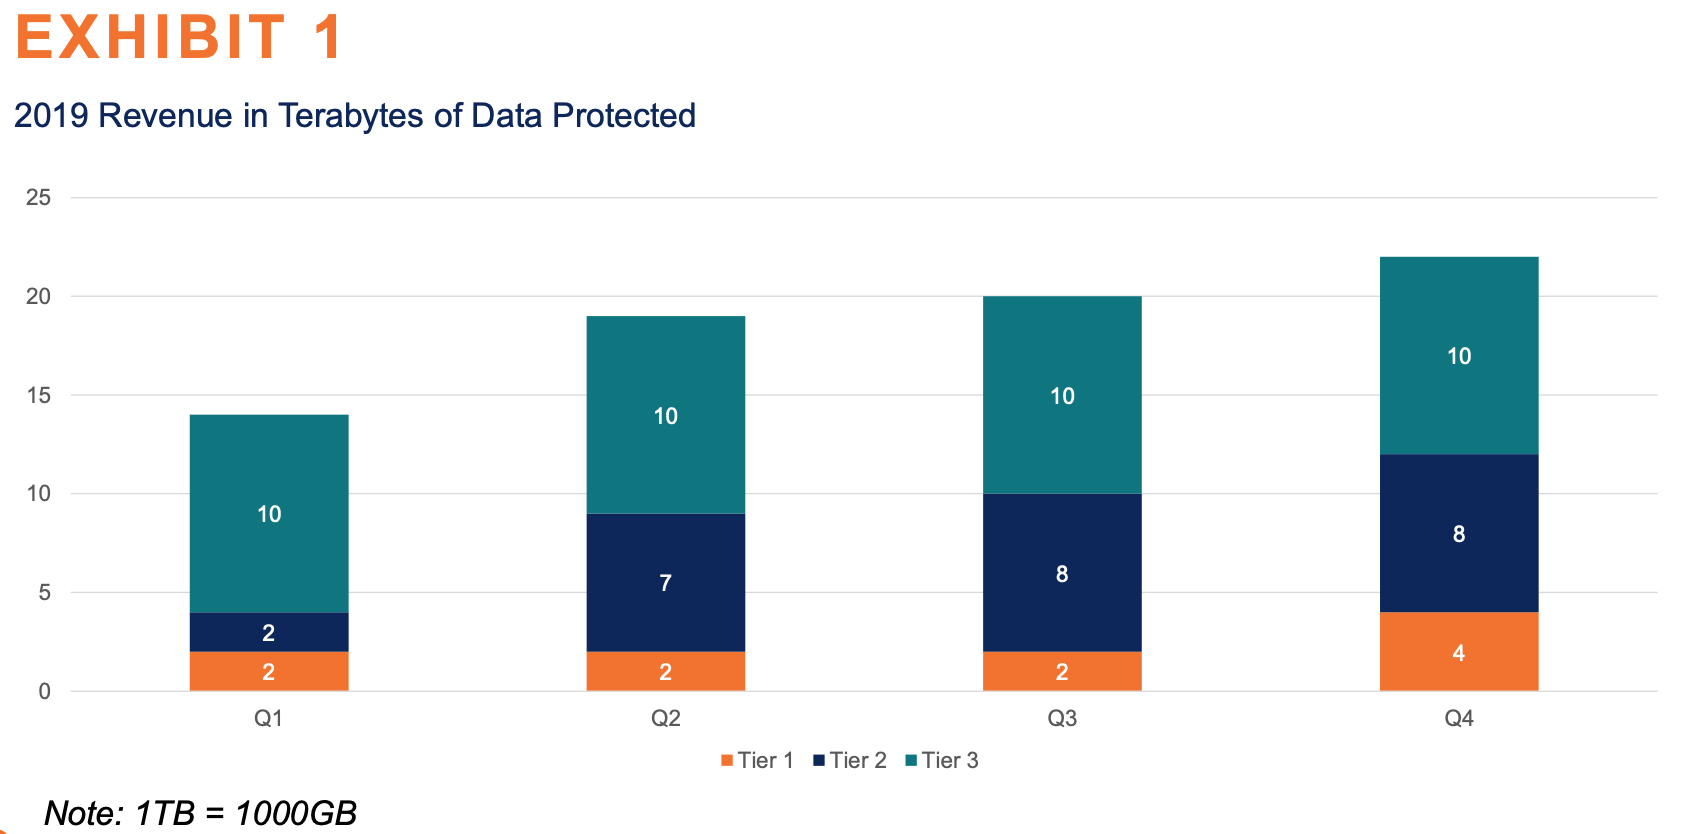
1) I know that exhibits sometimes have info left out intentionally to see if you can deduce the right questions, but here I'm struggling to see how for eg they got to a monthly profit of $100k for Tier 1 product in Q1. I would assume that $100k is the profit for the whole year for Tier 1 [ (2+2+2+4)TB x 1000GB x $10 ]. What is the bit of insight/info I'm missing?
2) Is the formula they've quoted as “discount in perpetuity formula” just the Present Value (of an asset/company) in perpetuity? So PV = free cash flow / discount rate - growth? Is this a commonly used formula? I've not seen it before, and not sure I've understood it correctly. Can I use this simplified version in future cases?
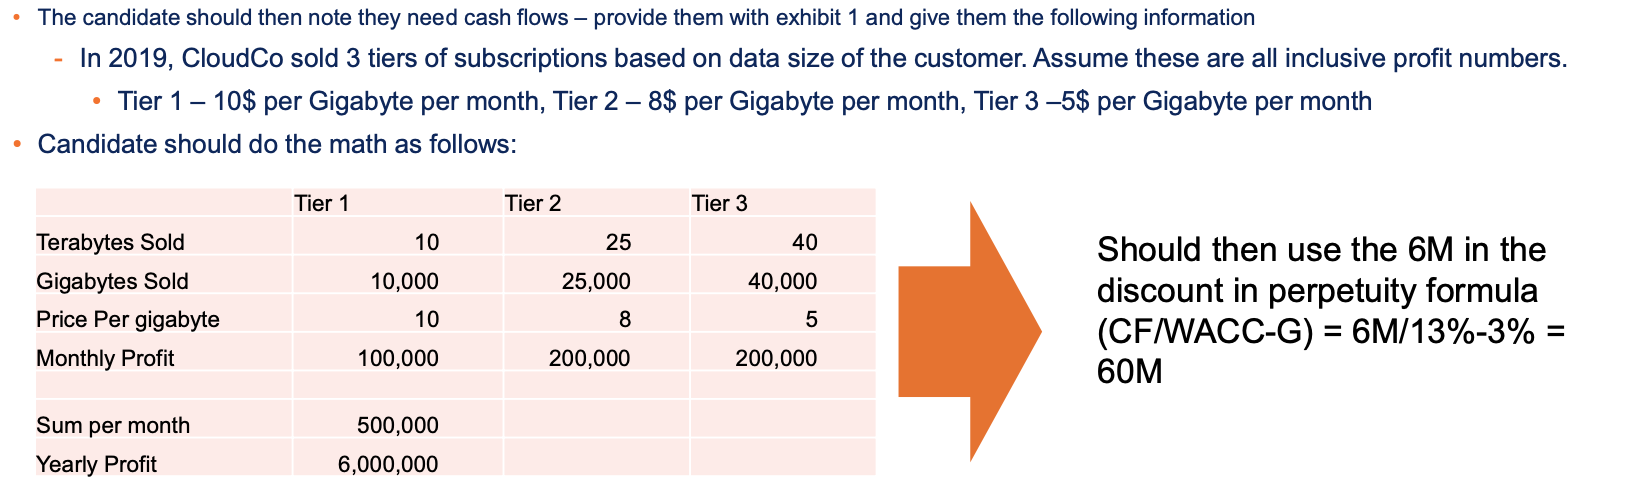


This is what I don't understand - I managed to get to $500k, but I can't understand how they got to $6mil yearly cost. How can $500k be the monthly costs when we've added up all the data sold across the year to arrive at this number?! Do you think this might be an error in the book?
thanks for pointing this out and apologies for, indeed, the typo :) Answer above updated accordingly.
Regarding your additional question, I definitely see your point. And I understand the unclarity. Without knowing much more about the case, my first guess might be that the case creator is projecting yearly revenue at a run rate.
In other words, taking this year standalone, we know we sold X TB of data for the different tiers. Hence, starting from next year we know that we will have a monthly recurring revenue equal to $500,000 (because we sold in the past year, and we earn each month from them). Therefore, multiplying $500,000 by 12 will produce the projected yearly revenue at run rate