Hi Alexander
The only other slide about Pasta is this one for value breakdown
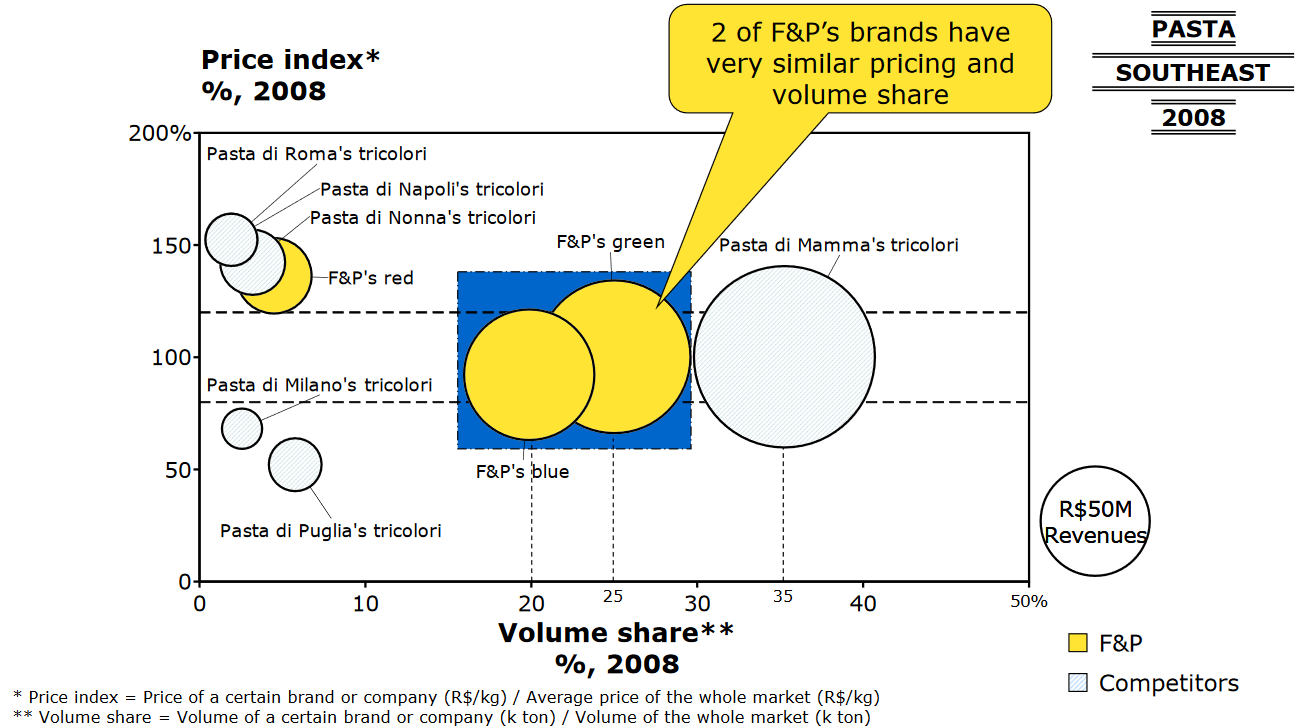
I thought about multiplying 49% * $389M to get F&P's total value in Southeast (the merger in question is only in the SE region) and try to use that to know how much would be 20% of the whole market for F&P's blue and 25% for F&P's green.
However 49% * $389M is ~$190M, way over the $50M total revenue from the original chart. And I still don't have any information about how many tons this would be
How can I use this info to get a value in tons? I don't see anything I can do with these slides