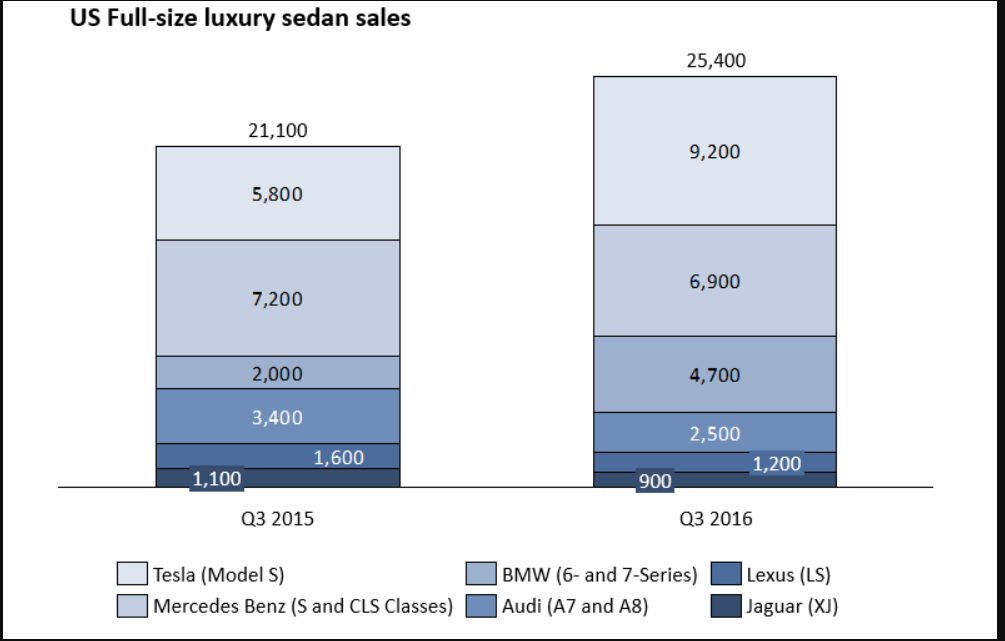
How does one right off the bat by just looking at a chart like this say, “Tesla captures one-third of the market” or Total sales are growing by 20% (I can calculate this on my sheet and get to this answer, but I see a lot of people doing it in their heads once they read a chart.) What's the trick?
I know if a number is doubling that's going to be a 100% growth. And if a number is increasing by half (such as 1000 in Y1 and 1500 in Y2 is 50% growth. But how can I eyeball for numbers that yield growths of 5% or 20% or 25%?