Schedule mock interviews on the Meeting Board, join the latest community discussions in our Consulting Q&A and find like-minded Interview Partners to connect and practice with!
Back to overview

Some problem in market sizing

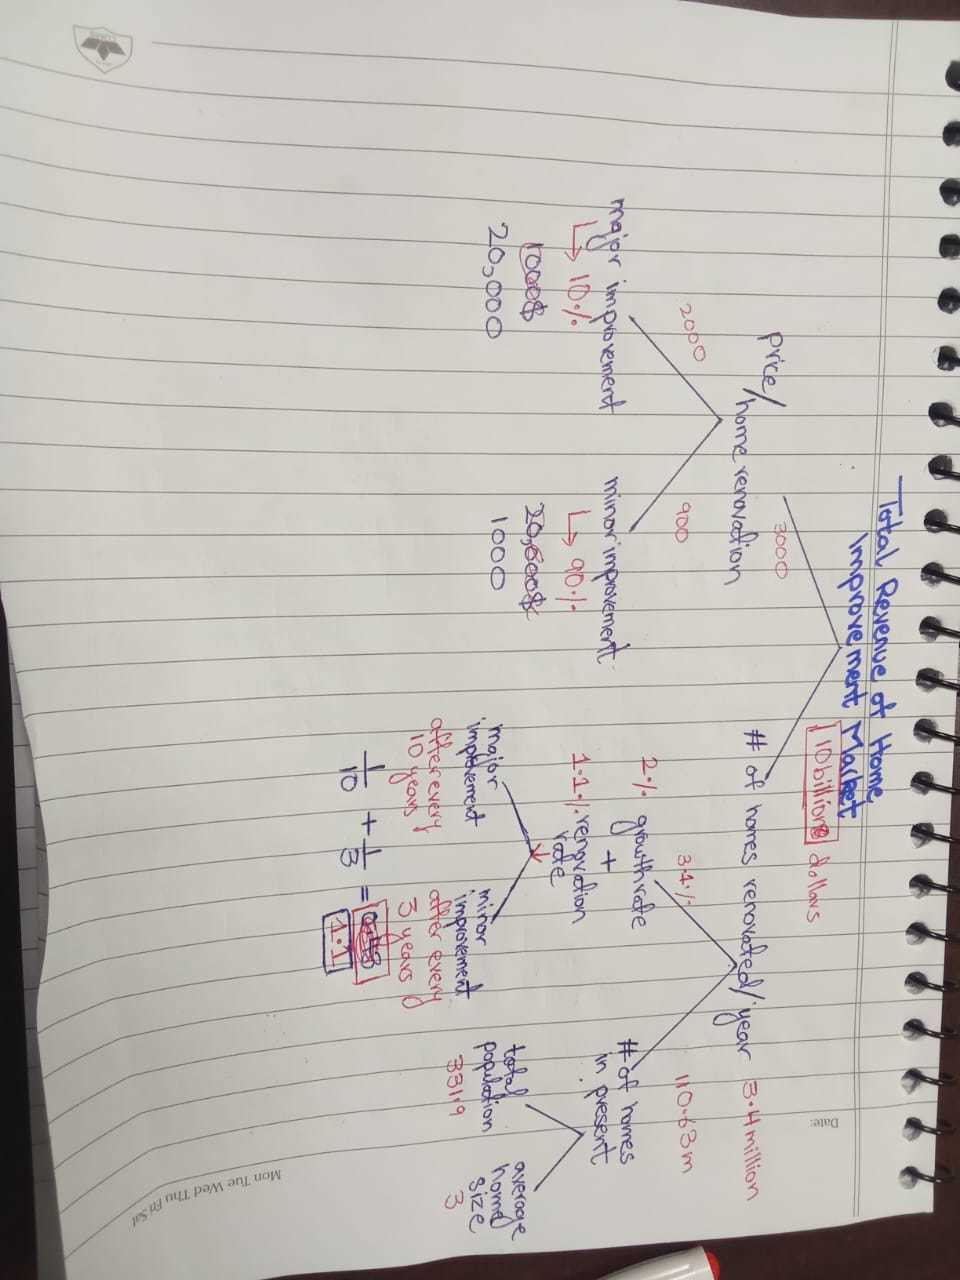
I came up with an answer of 10billion dollars home renovation market per year. But, I think I have done something wrong because numbers is very small. I think assumptions are off. Someone can help please

3
800+
14
Be the first to answer!
Nobody has responded to this question yet.
Top answer
Pedro
Coach
on Mar 14, 2024
Most Senior Coach @ Preplounge: Bain | EY-Parthenon | RB | Principal level interviewer | PEI Expert | 30% in October

Sorry to tell you, there are plenty of mistakes in there.

  • If you want to segment between large renovation and small renovation, treat each of these as a segment (i.e. estimate separately the total renovation value for each segment). Using your approach, you did a mistake: the % of major vs. minor renovations on the left is 10-90%, but on the right is 1/10 (10%) vs. 1/3 (33%), which is actually 10/43% vs. 33/43%. Basically you are assuming different breakdowns for the same thing.
  • Looking at the right, you are considering new homes… (that 2% growth rate). That is not renovation, so no reason to be here
  • Then on the % of renovations below, you have the 1.1% number. Well, it's a math mistake. 1/10 + 1/3 =10% + 33% = 43%. I don't even understand how you got to 1.1%. But you can see, just from here, that using your assumptions the correct number for this would be 40x what you had. 
  • Still on the last two… if you have 3.1% renovation per year…that means a house being renovated every 30 years (which is inrealistic). You have to make these types of calculations to check your number.

Other than that, the values you have for large and small renovations are low - but the values you use here will depend on the frequency of renovation you chose. 

An alternative approach would be to consider a certain “use period” for the house components and thinking how much % of them is “used per year”. Paint may last 10 years (10% per year). But floor, hardware (e.g. cabinets), appliances, maybe last 20 (5% per year); electrical, plumbing, ceramics… maybe 50 (2% per year). Estimate their cost and apply the % and you get to your target value.

Anonymous A
on Mar 19, 2024
Hi! Thankyou
Ian
Coach
on Mar 15, 2024
Top US BCG / MBB Coach - 5,000 sessions |Tech, Platinion, Big 4 | 9/9 personal interviews passed | 95% candidate success

Hi there,

  1. growth rate on RHS not needed
  2. Where'd you get major/minor improvement %?
  3. Might be worth splitting by pop by income/wealth
  4. Major/minor improvement numbers are way too low

I actually have a super cheap market sizing video course that you can use to practice your market sizing - definitely consider it to improve!

Market Sizing Analysis: Approaches, Techniques, and Exercises (preplounge.com)

on Mar 15, 2024
#1 Rated & Awarded McKinsey Coach | Top MBB Coach | Verifiable success rates

First of all, my neck is sore from having to look horizontally at the image :)

Fully agree with Pedro's approach. 

Aside from this, I do appreciate the structure that you used, in the sense of approaching it like an issue tree. Typically, you either go for an issue tree or a linear set of filters and you made a good choice in this case.

Best,
Cristian

Anonymous
on Mar 19, 2024
Sorry. Actually I tried horizontal