Hi guys,
I am a bit confused, can you help me to clarify something please?
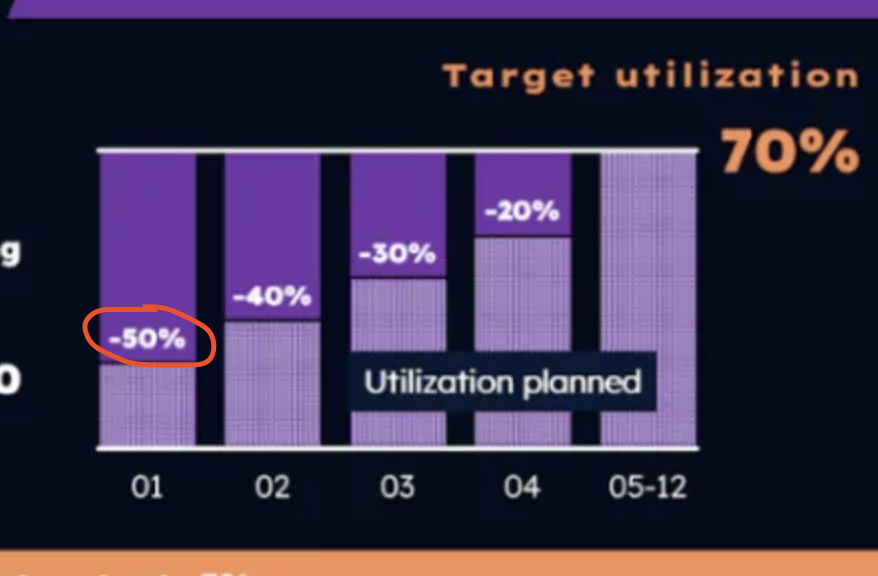
In the initial graph in Jan the given utilization rate is 50% but in the table with solution we calculate as 20%… Is it a mistake or I did not get it right?
Thanks!


Hi guys,
I am a bit confused, can you help me to clarify something please?
In the initial graph in Jan the given utilization rate is 50% but in the table with solution we calculate as 20%… Is it a mistake or I did not get it right?
Thanks!

No, it's right.
It's just expressed in a way that is meant to confuse you.
Basically, where it says ‘70%’ that's the absolute max of the bar.
Then the bars to the left of that are with the ‘-’ sign. The leftmost bar is ‘-50%’ and 70-50% is 20%. So it's the same number.
Hope that makes it clear.
You might also find this useful:
Best,
Cristian

Hi there,
I would be happy to share my thoughts on your question:
If you would like a more detailed discussion on how to best prepare for your upcoming interviews, please don't hesitate to contact me directly.
Best,
Hagen
You can find the salary report of consulting firms in Germany here!

Target Utilization: 70%
Deviation from target Utilization: -50%
Real Utilization: 20%