
Now that we have covered the text aspects, let's move on to another crucial component in our presentation which are graphs. Showcasing data is a very, very, very important tool because as a consultant you are not even allowed to make assumptions without hard data to prove it. So, we use a lot of graphs to showcase this data so you will be using the graph tool a lot.
Now there are different graphs that we use in our presentations so let's discuss the primary ones that we use:
- Column & bar graphs: The column & bar graph is the main graph-type that you use in your presentation. It is used to showcase every type of data.
- Line chart: The line chart is a standard line graph that showcases serial data, e.g. developments over time.
- Pie chart: Pie charts are also very common in our presentations and are primarily used to showcase breakdown data like market share.
- Doughnut chart: The Doughnut chart is a popular alternative for the pie chart which can be used to showcase breakdown data like market share, revenue contribution, capital expenditure contribution etc.
- Combination charts: These graphs are typically a combination of a column graph and a line graph like a combo between economic GDP and unemployment rates.
- Waterfall chart: This is a specific type of graph which looks like a waterfall or a staircase. It can be used in a variety of options and looks very, very good in a presentation.
So, we will showcase how to format these graphs in PowerPoint. It is easy to make them, but we format them in a different way in the consulting sector. Let's look at an example and the key aspects we delete/edit:
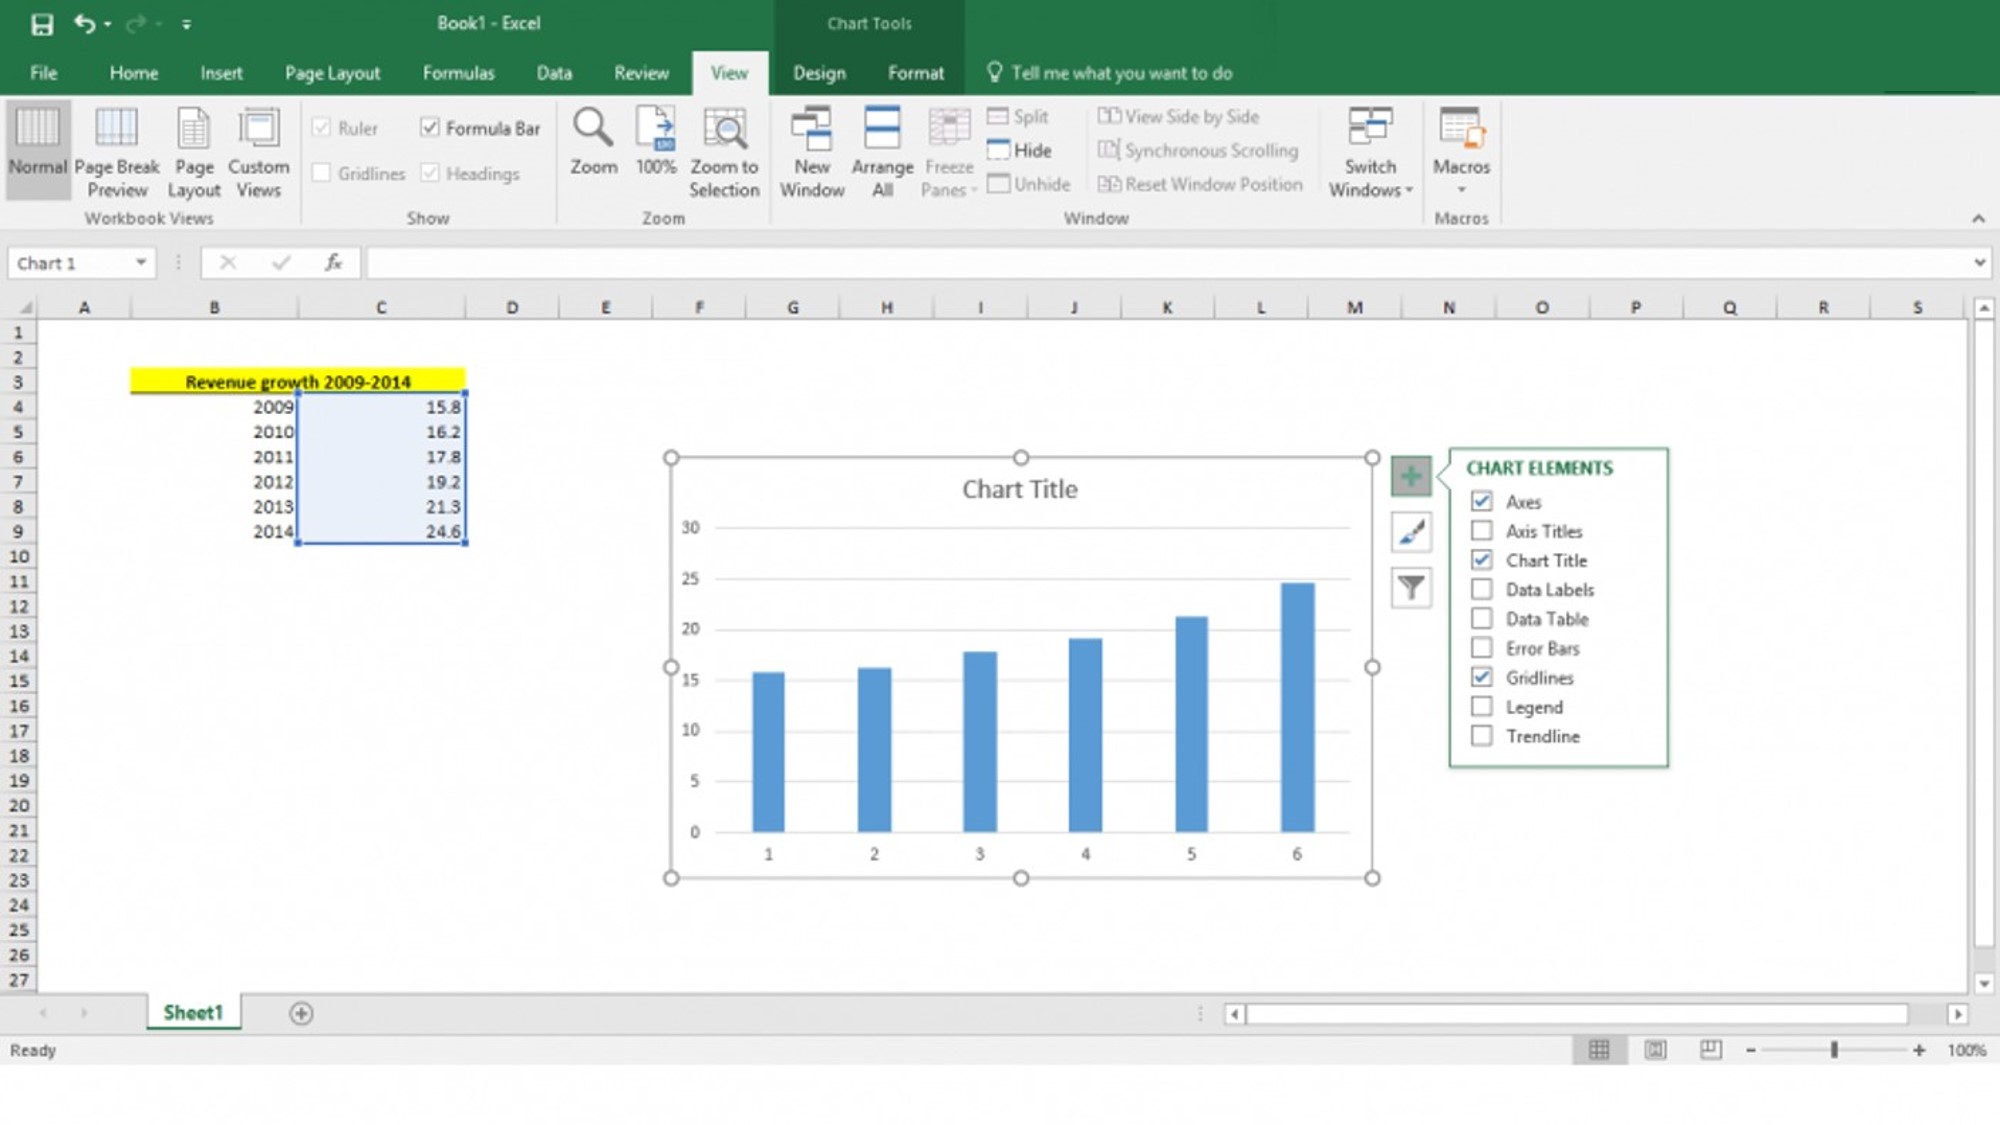
This is a sample of our graph and as you see it has a few items that we will be editing.
- First, we remove the chart title as we will create our own.
- Second, we remove the y-axis as we will use data labels where the data shows on top of each column.
- Thirdly, we remove the grey interlining/gridlines as they have no purpose.
Then we tick on the data labels so we can see revenue for each year in the graph and we edit the x-axis. The rest of the editing will be done in PowerPoint. So if we do the first few edits, we get the following result:
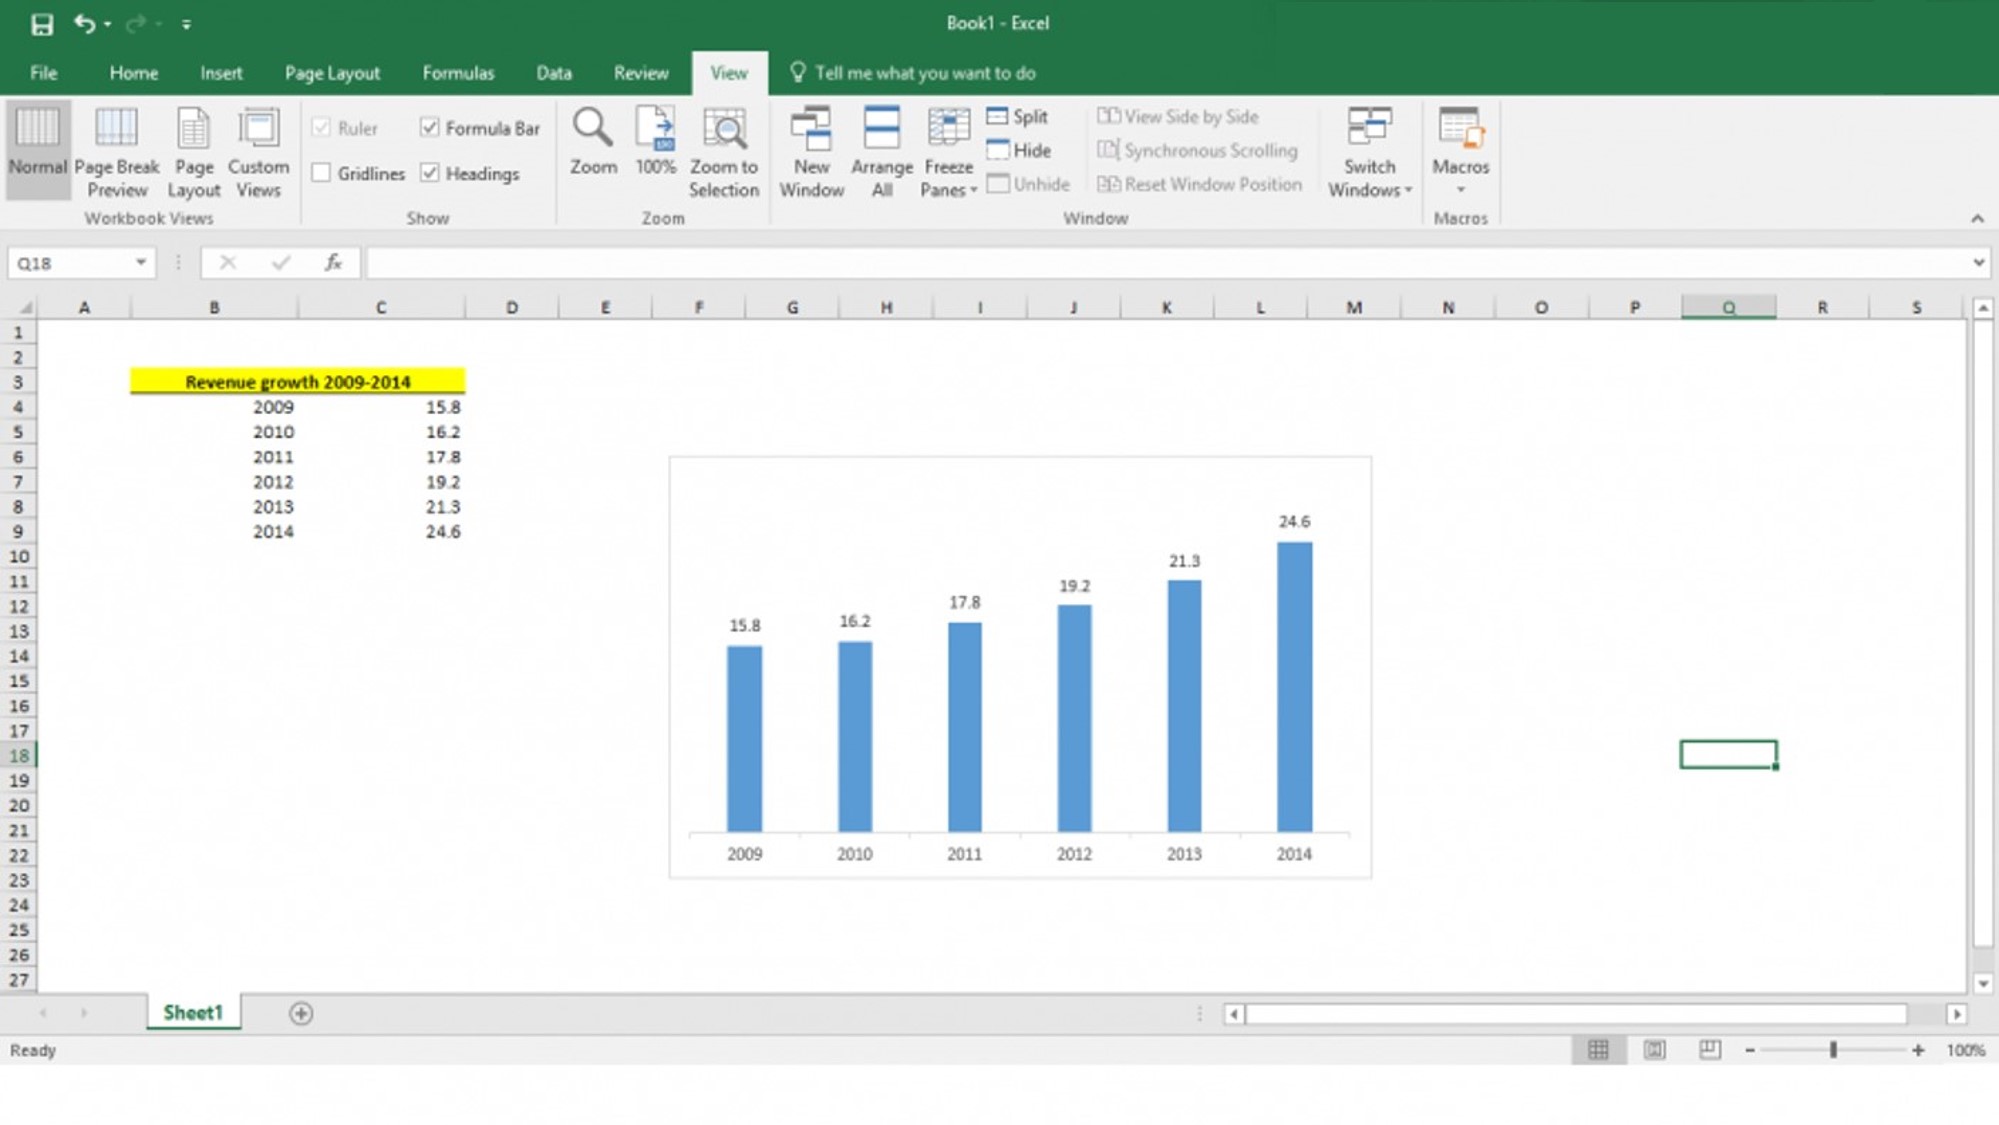
You see that we now have a clean basic graph which we can then copy into our PowerPoint slide. Remember that you can also insert a graph into your slide from PowerPoint itself. You just have to edit the data then. If you don't and you copy the graph from Excel to your .ppt then do not delete the data in your Excel file as it will delete your graph in PowerPoint. Those two are interconnected.
Now in PowerPoint we are going to add the following items:
- We will add in a rectangle that will be our title box. Alternatively you can also use a textbox as a title. Note that it is important to mention in your title box the graph title, year or period and if applicable the denomination such as million Dollars or billion Dollars or Percentages by adding these items ($/Mn), (€/Bn), (%).
- Then we will edit the spacing between each column since now they are quite far apart from one another.
- Then we will edit the colors of the column bars with a fill and an outline. Again here: stick to 1-2 color patterns.
- Finally, we will add in a dark black line that will be placed on the x-axis.
If we make those edits, we get the following result:
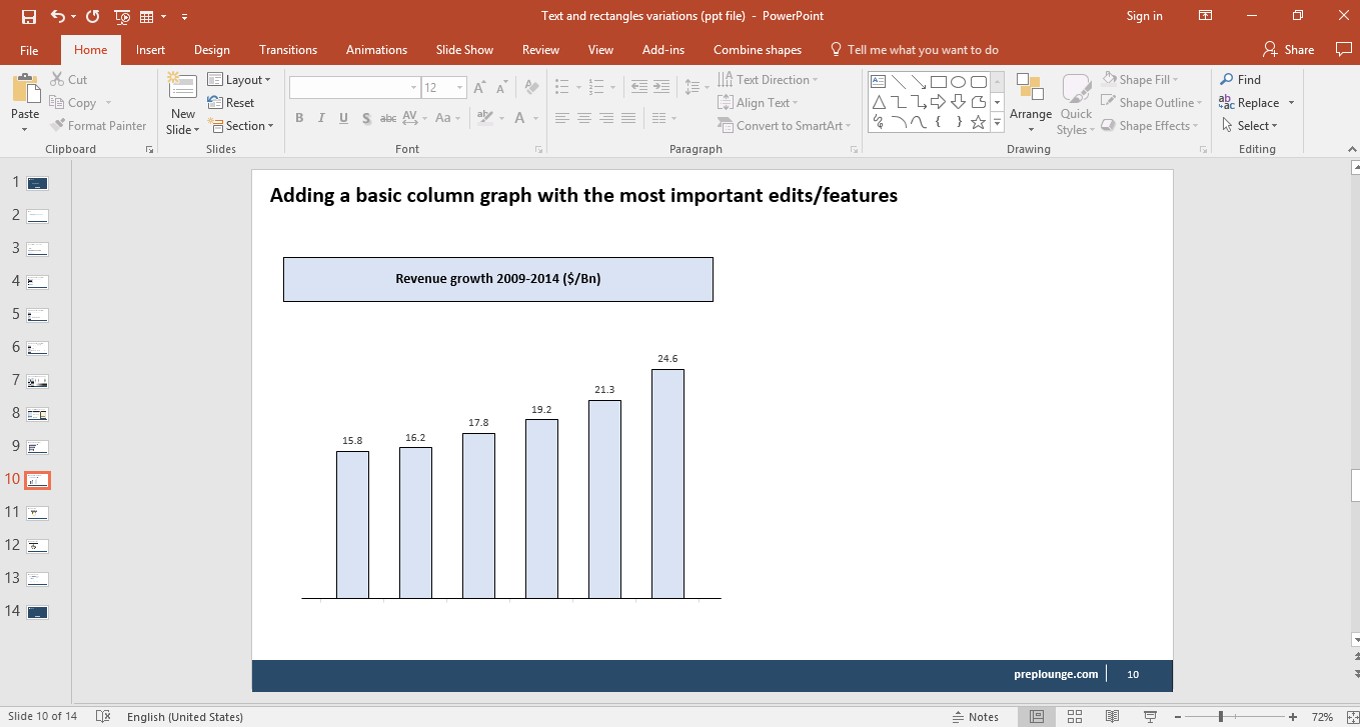
This is how our basic graph looks like with a title box, colors in the right pattern, less space between bars and a black line on the axis. These edits and features are used for all graphs and charts we create including the column, bar, line graph and the pie chart and combined charts.
Now let's look at the videos to see how we can make each graph.