Get Active in Our Amazing Community of Over 450,000 Peers!

Schedule mock interviews on the Meeting Board, join the latest community discussions in our Consulting Q&A and find like-minded Case Partners to connect and practice with!

Charts questions

case math
New answer on Mar 09, 2023
3 Answers
442 Views
Anonymous A asked on Mar 02, 2023

Dear all, 

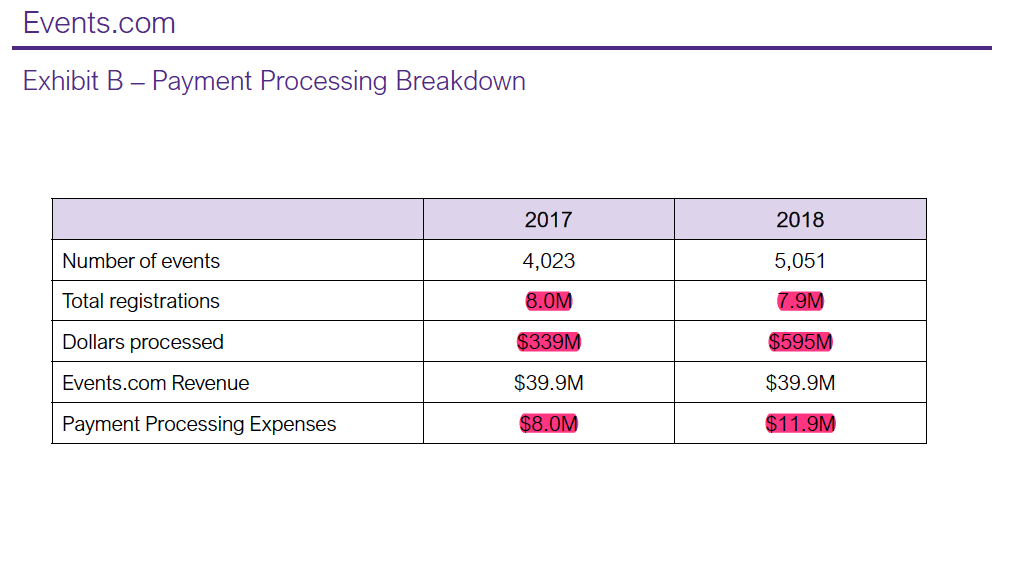
I always have problems reading charts. Now, I'm trying to make sense of the first chart - exhibit B payment processing breakdown. Would appreciate your help! 

Below is the case prompt. 

Our client is Prospect Equity Partners (‘Prospect’). They have recently acquired Events.com.

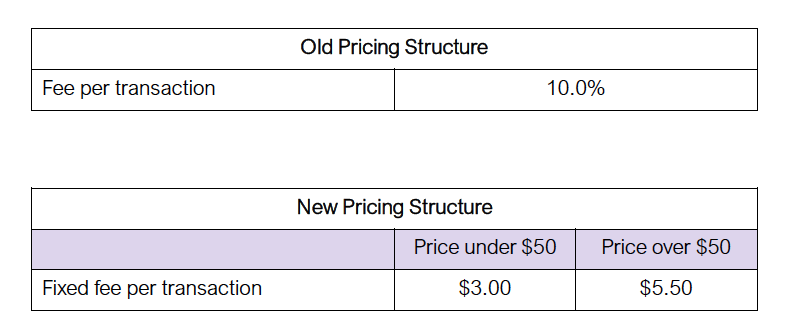
Events.comis a leading SaaS-based registration/ticketing platform for Endurance events (5K runs, Marathons, Triathlons, Mud Runs, etc.). They make money by taking registrations and processing payments for events and charging a fee per transaction (similar to Ticketmaster or Eventbrite) ($100 registration price x 10% Fee = $10 in Revenue for Events.com)

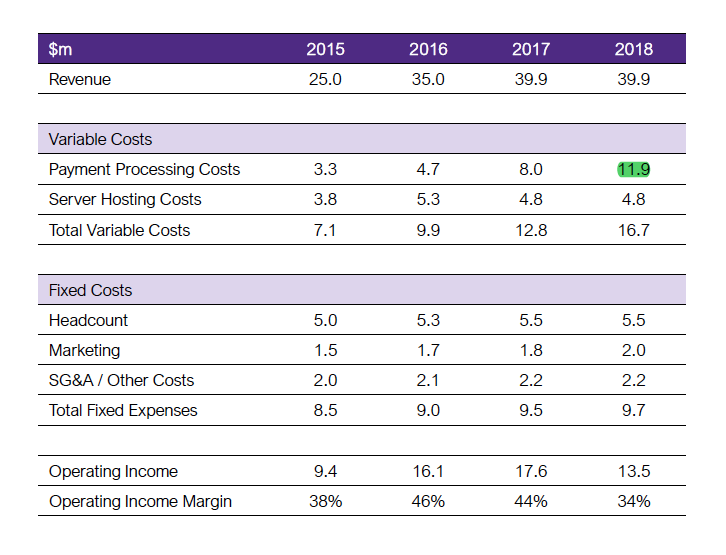
•Events.com has doubled market share since 2015, but in the last two years revenue is flat and profits are down, despite growing share. Prospect wants you to determine what is causing this and come up with a plan to improve profitability

Below is my understanding of chart B 

1. I calculated average price per registration for 2017 and 2018 

$339M/8M= $42  and $595M/7.9M=75 

2. Then I calculated average revenue per registration for 2017 and 2018 

$39.9M/8M=$4.9 and $39.9/7.9M= $5 

3. Compare those numbers, conclusion is - we used to make more than 10% per registration on average, now is only 6.7%. so the pricing structure is the roots of this problem. 

4. payment processing expenses increased is due to the increased money we processed- from 339M to 595M. 

Is my interpretation correct? 


Overview of answers

Upvotes
  • Upvotes
  • Date ascending
  • Date descending
Best answer
Hagen
Expert
Content Creator
updated an answer on Mar 02, 2023
#1 Bain coach | >95% success rate | interviewer for 8+ years | mentor and coach for 7+ years

Hi there,

I would be happy to share my thoughts on it:

  • Yes, this is correct.
  • Since the value per registration increased, the company should have stuck to its percentage charging model to equally scale its revenues. However, they changed to a fixed-fee charging model, resulting in decreasing revenues per payment processing and, as such, stagnating revenues.
  • Moreover, since payment processing costs still scale, the contribution margin decreased and, as such, profits decreased.

If you would like a more detailed discussion on how to best prepare for your upcoming interviews, please don't hesitate to contact me directly.

Best,

Hagen

(edited)

Was this answer helpful?
Francesco
Expert
Content Creator
replied on Mar 09, 2023
#1 Coach for Sessions (4.500+) | 1.500+ 5-Star Reviews | Proven Success (➡ interviewoffers.com) | Ex BCG | 10Y+ Coaching

Hi there,

Q: Is my interpretation correct? 

Yes, the interpretation is correct. 

With the analysis you performed with 1 and 2, you can derive that there was a new pricing structure implemented which led to the same revenues as before despite the higher amount of dollars processed. 

Payment processing fees instead still have a positive correlation with the amount of dollars processed, leading to an increase in costs compared to the past and, given revenues are still the same, lower profits.

Best,

Francesco

Was this answer helpful?
Pedro
Expert
replied on Mar 02, 2023
30% off in April 2024 | Bain | EY-Parthenon | Roland Berger | Market Sizing | DARDEN MBA

This is quite strightforward. The company changed its price structure (in practice lowering average fees per transaction). It kept revenue because it has much more transactions, but now has much higher processing costs.

What to do: revise price structure…

Was this answer helpful?
How likely are you to recommend us to a friend or fellow student?
0
1
2
3
4
5
6
7
8
9
10
0 = Not likely
10 = Very likely