Schedule mock interviews on the Meeting Board, join the latest community discussions in our Consulting Q&A and find like-minded Interview Partners to connect and practice with!
Back to overview

Interpretation of given data

I am wondering if the solution given for the interpreation of the sales channel data is correct.

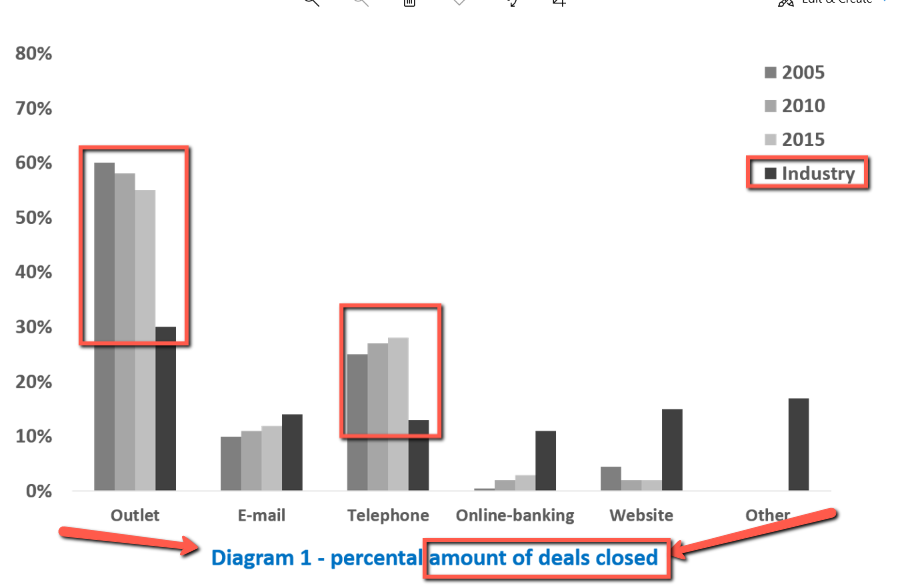
It is stated that "From the data provided we can conclude that the bank is strong (in some cases even exceptionally good) in its traditional business, compared to industry averages."

However, doesn't the chart only indicate the distribution of sales (and not success) through the channels in comparison to industry average? Isn't the takeaway here that the company significantly differs from industry average and the focus is higher on 'outlet' and 'telephone'? And lower on digital channels?

Just because 'outlet' is the most used channel, it doesn't mean that it is successful, right? Especially in the context of declining customers and sales.

1
3.4k
26
Be the first to answer!
Nobody has responded to this question yet.
Top answer
Ian
Coach
on Jul 17, 2021
Top US BCG / MBB Coach - 5,000 sessions |Tech, Platinion, Big 4 | 9/9 personal interviews passed | 95% candidate success

Hi Richard,

I don't know this case well, but a quick glance at the exhibit tells me you're likely misinterpreting things! Diagram 1 is success. (% of deals closed). Our company is very good at Outlet and Telephone channels.

on Aug 04, 2022
I totally misunderstood this information. I thought "deal closed" means "loss of deals due to the decrease of customers", so outlet and telephone have the worst performance...
Similar Questions
Consulting
Question about
Channel Profitability of Outlets & Recommendations
on Jun 15, 2023
Global
1
1.1k
Top answer by
Deleted
Coach
Ex-Deloitte | Global| M&A | Boutique Consultancy | Former MBA Recruiting Lead | 6 Years of Interviewing Experience
20
1 Answer
1.1k Views