Get Active in Our Amazing Community of Over 451,000 Peers!

Schedule mock interviews on the Meeting Board, join the latest community discussions in our Consulting Q&A and find like-minded Case Partners to connect and practice with!

Percentage change?

Graph Math problem
New answer on Apr 15, 2021
2 Answers
1.0 k Views
Floyd asked on Apr 15, 2021

Hello everyone!

I hope you're doing fine.

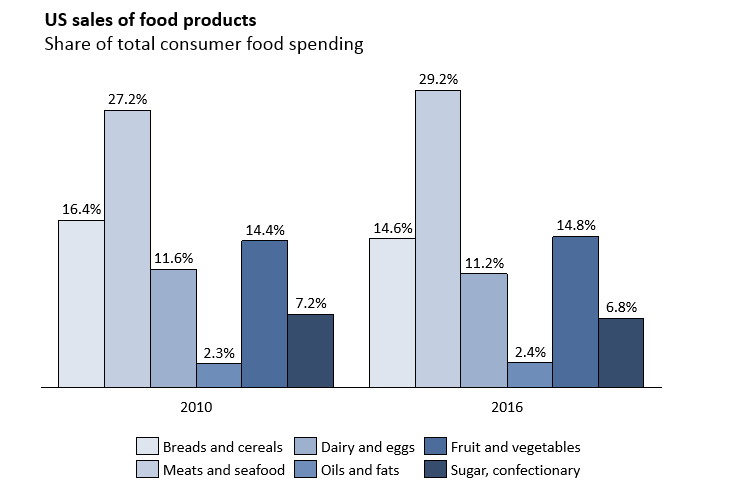
I have the following picture. I would like to analyse by how much did the consumer spending on bread and cereal products decreased?. Which of this two approaches ir right:

1. It decreased 1.8% = 14.6% - 16.4%

or

2. It decreased 10.9% = (14.6% - 16.4%)/16.4%

Thank you very much.

Overview of answers

Upvotes
  • Upvotes
  • Date ascending
  • Date descending
Best answer
Ian
Expert
Content Creator
replied on Apr 15, 2021
#1 BCG coach | MBB | Tier 2 | Digital, Tech, Platinion | 100% personal success rate (8/8) | 95% candidate success rate

Hi Floyd,

Henning is absolutely right here. We cannot say for certainty unless we know the absolute spend.

The % of total spend decreased by 10.9%...and it also decreased by 1.8 percentage points.

If you'd like more practice reading charts, I'd highly recommend you start reading the Economist daily. In particular, their graphic detail section is fantastic.

https://www.economist.com/graphic-detail

Was this answer helpful?
Anonymous replied on Apr 15, 2021

None of the above. Without knowing the total spend, the spend on bread & cerial could also have increased for all that you know.

If you're asking by how much the share of total consumer food spending spend for bread & cerials has changed, then: it decreased by 1.8ppts (percentage points) or 10.9%. Although the first one is (by far) the preferrable way of communication. Percent of percent (10.9% of 16.4%) is a very unintuitive metric.

Was this answer helpful?
14
How likely are you to recommend us to a friend or fellow student?
0
1
2
3
4
5
6
7
8
9
10
0 = Not likely
10 = Very likely