Get Active in Our Amazing Community of Over 451,000 Peers!

Schedule mock interviews on the Meeting Board, join the latest community discussions in our Consulting Q&A and find like-minded Case Partners to connect and practice with!

AT Kearney mock test question

graph reading
New answer on Jan 15, 2020
3 Answers
2.6 k Views
Joo
Proficient
asked on Jan 09, 2020

Hello, I'm having trouble understanding why the answer to this question is C.Hungary, perhaps I am understanding the question wrong, could you please explain the rationale?

Q 3.2.2: What was the country with the highest relative increase between 2007 and 2008?
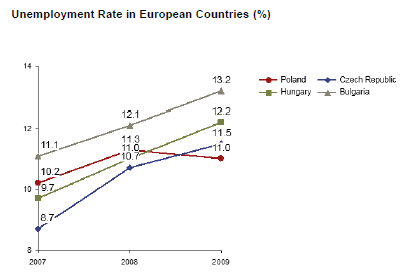
AT Kearney What was the country with the highest relative increase between 2007 and 2008

Answer choices:

A. Poland / B. Czech Republic / C. Hungary / D. Bulgaria / E. Cannot answer

I thought the answer was B.Czech Republic because from 2007 to 2008, the increase in percentage point was the largest (10.7 - 8.7 = 2.0%).

Overview of answers

Upvotes
  • Upvotes
  • Date ascending
  • Date descending
Best answer
Luca
Expert
Content Creator
replied on Jan 10, 2020
BCG |NASA | SDA Bocconi & Cattolica partner | GMAT expert 780/800 score | 200+ students coached

Hello Joo,

Please notice that when you talk about "relative increase" you have to divide the delta (new value - old value) by the original value.


For example, in the case of the Czech Republic:

( 2008UR - 2007UR ) / 2007UR = (10.7% - 8.7%) / 8.7% = 23%

Anyway you are right, the correct answer is B because for Hungary you have:

(11% - 9.7%) / 9.7% = 13%

Hope it helps,
Luca

Was this answer helpful?
Joo on Jan 10, 2020

Thank you for the clear explanation! :)

Antonello
Expert
Content Creator
updated an answer on Jan 15, 2020
McKinsey | NASA | top 10 FT MBA professor for consulting interviews | 6+ years of coaching

Hi,
I confirm it's an error, but it's crucial that you fix this formula well explained by Luca for your case resolutions.

Best,
Antonello

(edited)

Was this answer helpful?
Joo on Jan 15, 2020

For sure, I understand the error in my working and marked a star on it. Thank you Antonello :)

Clara
Expert
Content Creator
updated an answer on Jan 10, 2020
McKinsey | Awarded professor at Master in Management @ IE | MBA at MIT |+180 students coached | Integrated FIT Guide aut

Hello!

You are falling into a classical trap -don´t worry, it´s super normal, particularly when you look at the graph!

If we were taking only about growth, the winner would be clearly Czech Rep -it can be easily seen in the pic, it´s the one whose slope is steepest-.

However, the trick is that they are asking for RELATIVE increase, so you have to divide the delta (new value - old value) by the original value.

  • Czech Republic: ( 2008UR - 2007UR ) / 2007UR = (10.7% - 8.7%) / 8.7% = 23%
  • Hungary: ​(11% - 9.7%) / 9.7% = 13%

Hope it helps!

Cheers,

Clara

(edited)

Was this answer helpful?
Joo on Jan 10, 2020

Thank you, it helped a lot :) Now I am certain there is an error in the answers page in the mock test.

How likely are you to recommend us to a friend or fellow student?
0
1
2
3
4
5
6
7
8
9
10
0 = Not likely
10 = Very likely