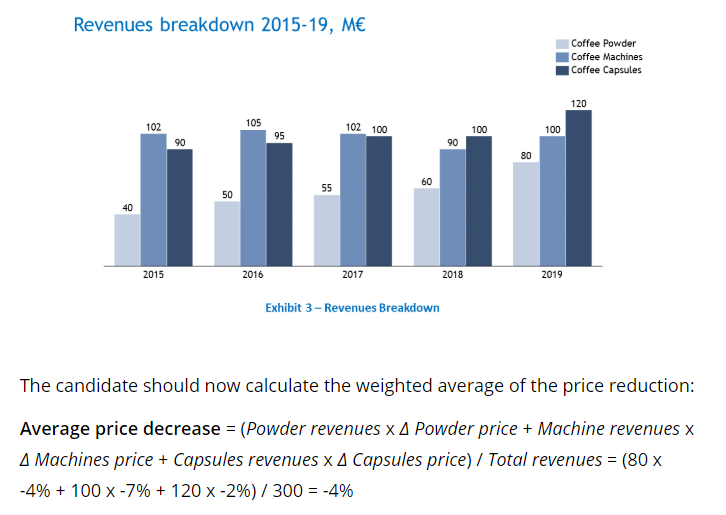
We are given the delta prices (easy to find from a previous chart) and then handed the following histogram showing revenues. The question is to calculate the average price decrease between 2018 and 2019. I am not understanding how the equation in the solution is established (does not make sense to me) :
This case is Espresso Whatelse on preplounge, can someone please reason the equation it looks like they are calculating the average decrease in price as the average decrease in price coming from product X contribution in total revenue + Product Y contribution in total revenue + Product Z contribution in total revenue (how would one know that the weight of a price decrease from 2018 to 2019 is the revnue from that product in 2019 / total revenues in 2019)
(editiert)